- Home >
- Stock Photos >
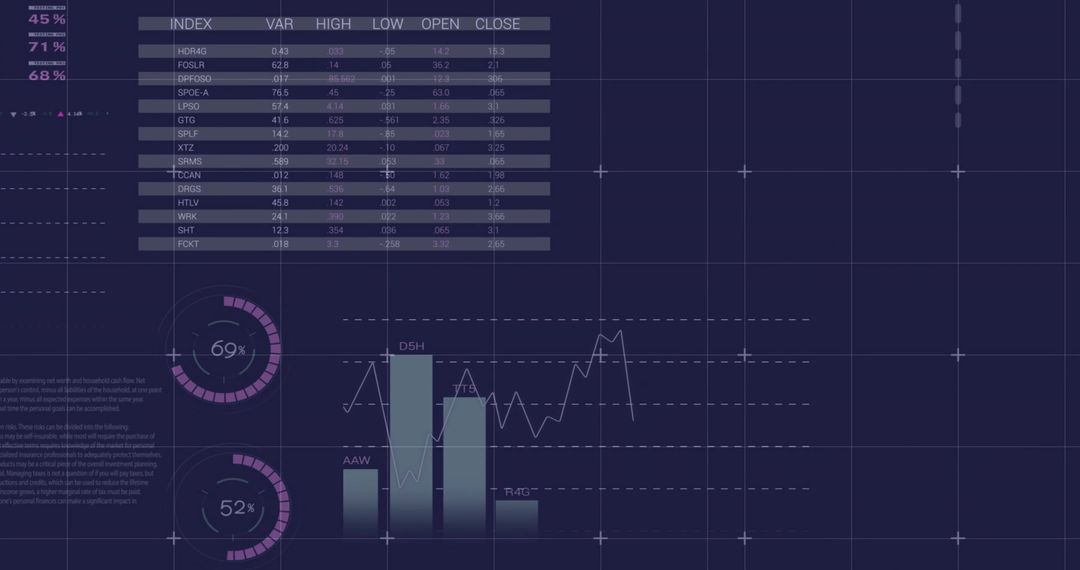
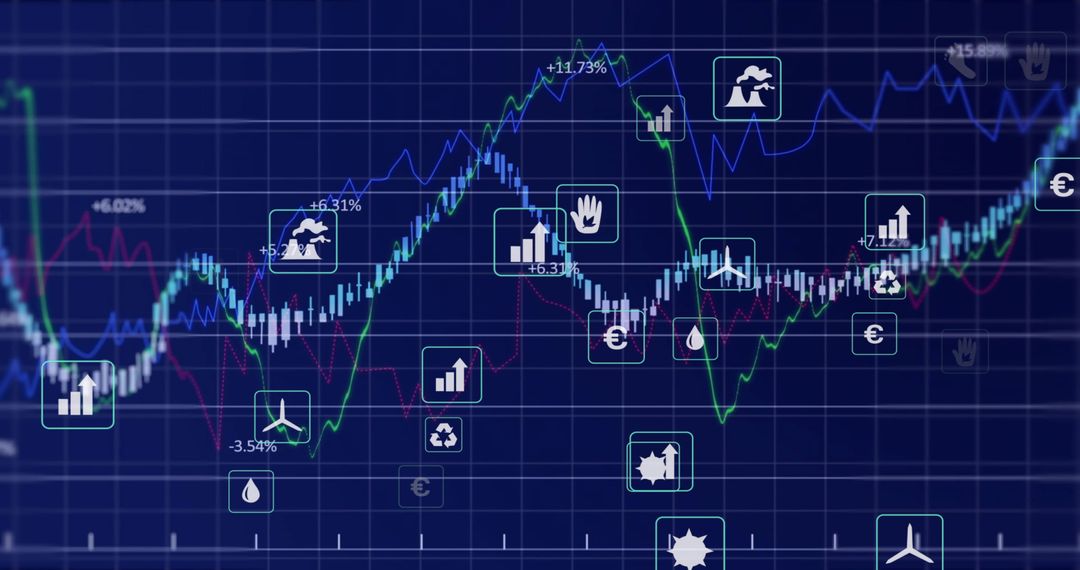
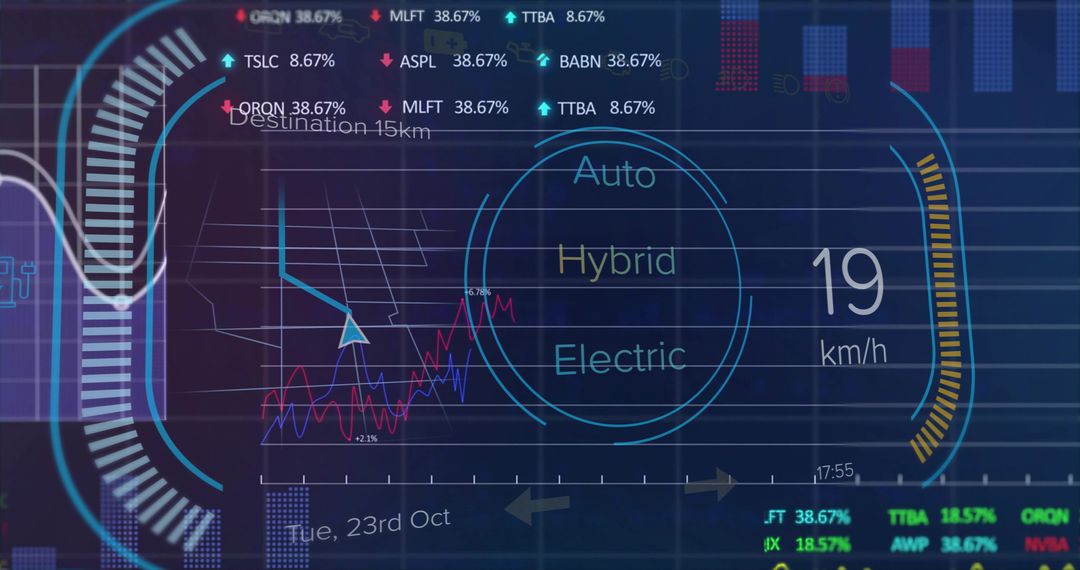
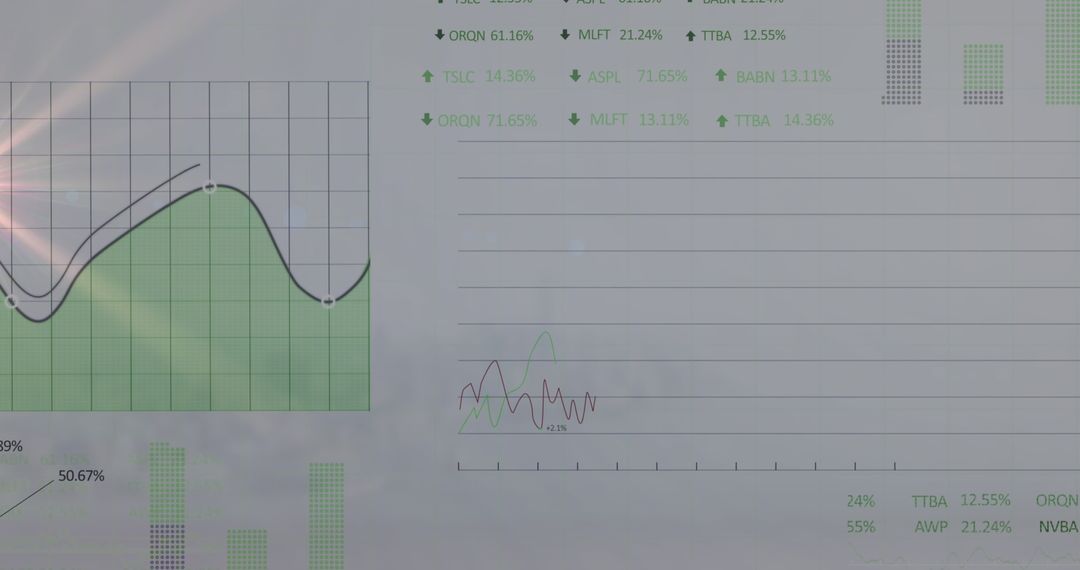
- Displaying Neon Energy Analytics Dashboard with Glowing Line Charts and Eco Tech Icons
Displaying Neon Energy Analytics Dashboard with Glowing Line Charts and Eco Tech Icons Image
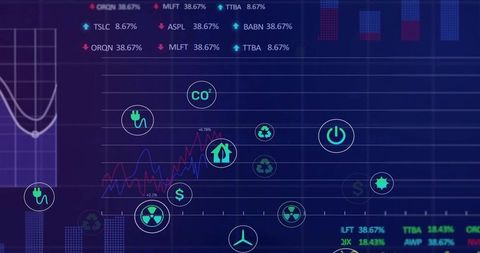
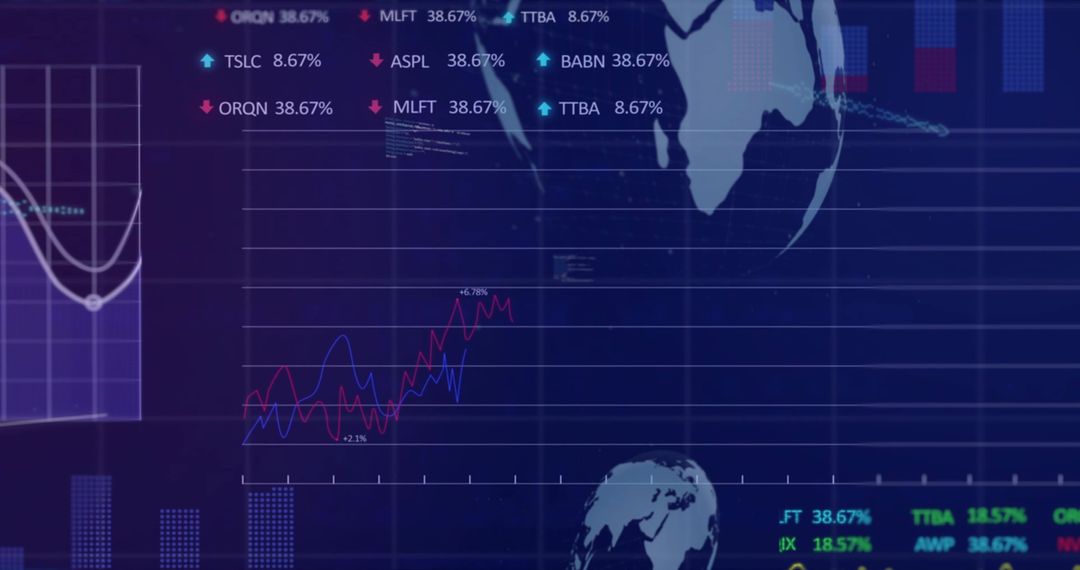
Featuring dark blue to purple gradient backdrop with glowing neon line charts, horizontal grid overlays, and circular energy icons representing CO2, recycling, wind, nuclear, electric plug, and power. Presenting clear metric markers and trend lines suitable for illustrating energy performance, emissions tracking, and resource management. Serving as website header, technology and sustainability presentation visual, annual report graphic, marketing campaign asset for green energy companies, app UI mockup, and social media banner. Pairing well with clean sans-serif fonts, neon accent colors, and minimal data labels for modern tech branding. Horizontal composition fitting hero banners and widescreen slides, while allowing cropping for thumbnails and thumbnails for mobile layouts.
Powered by  - Get 15% off with code: PIKWIZARD15


0
downloads
downloads
Tags:
More
Credit Photo
If you would like to credit the Photo, here are some ways you can do so
Text Link
photo Link
<span class="text-link">
<span>
<a target="_blank" href=https://pikwizard.com/photo/displaying-neon-energy-analytics-dashboard-with-glowing-line-charts-and-eco-tech-icons/85a424cc5c77cb59d510283786157b0a/>PikWizard</a>
</span>
</span>
<span class="image-link">
<span
style="margin: 0 0 20px 0; display: inline-block; vertical-align: middle; width: 100%;"
>
<a
target="_blank"
href="https://pikwizard.com/photo/displaying-neon-energy-analytics-dashboard-with-glowing-line-charts-and-eco-tech-icons/85a424cc5c77cb59d510283786157b0a/"
style="text-decoration: none; font-size: 10px; margin: 0;"
>
<img src="https://pikwizard.com/pw/medium/85a424cc5c77cb59d510283786157b0a.jpg" style="margin: 0; width: 100%;" alt="" />
<p style="font-size: 12px; margin: 0;">PikWizard</p>
</a>
</span>
</span>
Free (free of charge)
Free for personal and commercial use.
Author: Authentic Images
Similar Free Stock Images

Premium


Premium


Premium


Premium


Premium


Premium


Premium


Premium


Premium


Premium


Premium


Premium


Premium


Premium


Premium


Premium


Premium


Premium


Premium


Premium


Premium


Premium


Premium


Premium