- Home >
- Stock Photos >
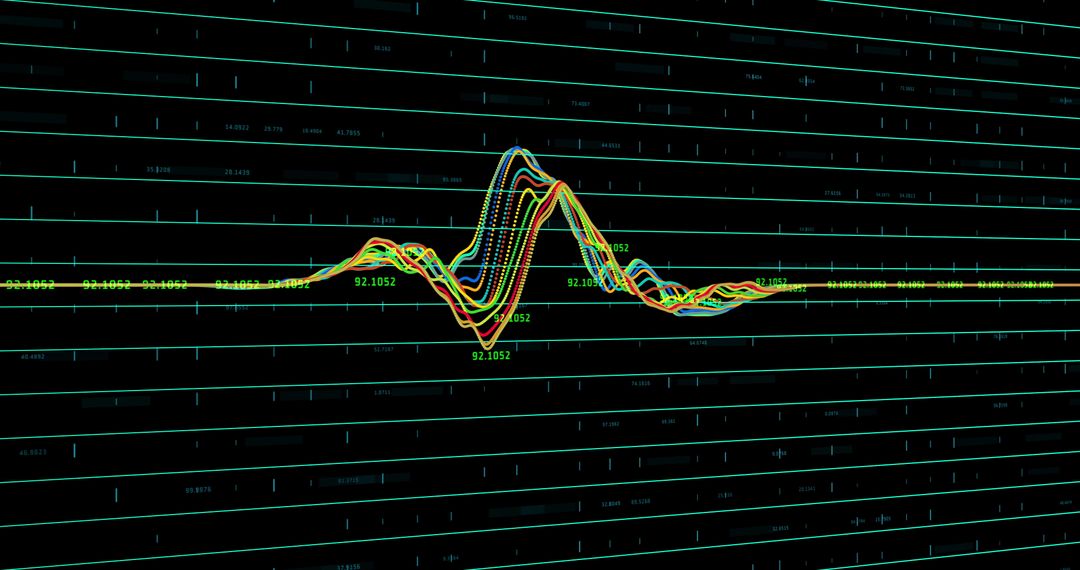
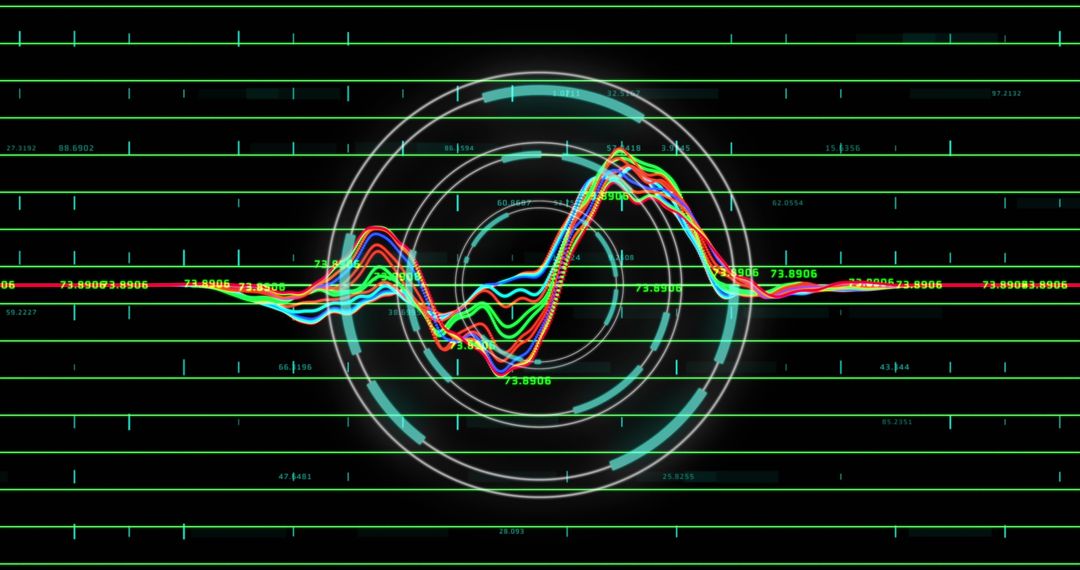
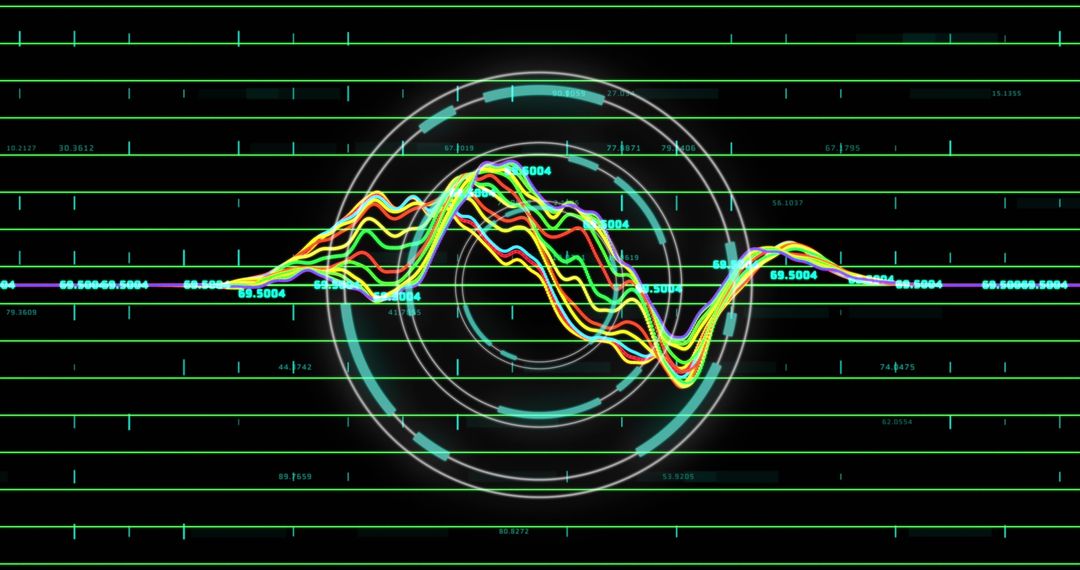
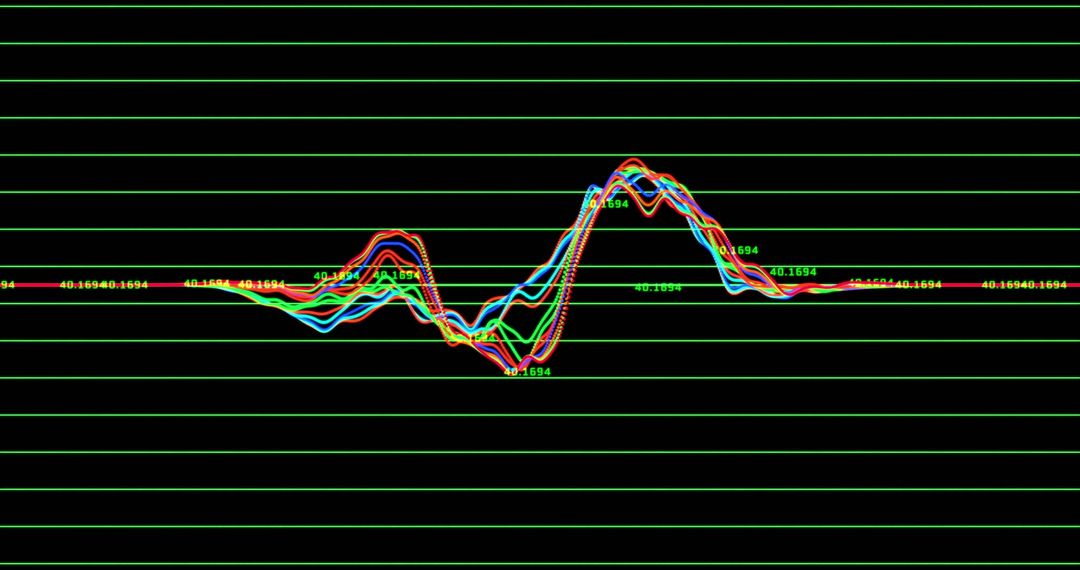
- Displaying Neon Waveform Analytics HUD Showing Colorful Oscillating Data Lines
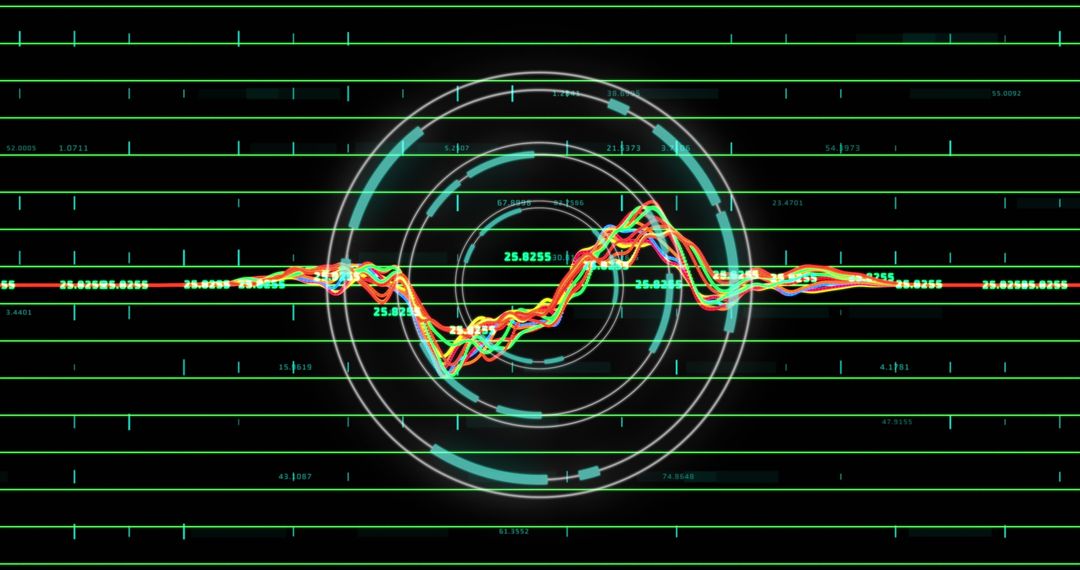
Displaying Neon Waveform Analytics HUD Showing Colorful Oscillating Data Lines Image

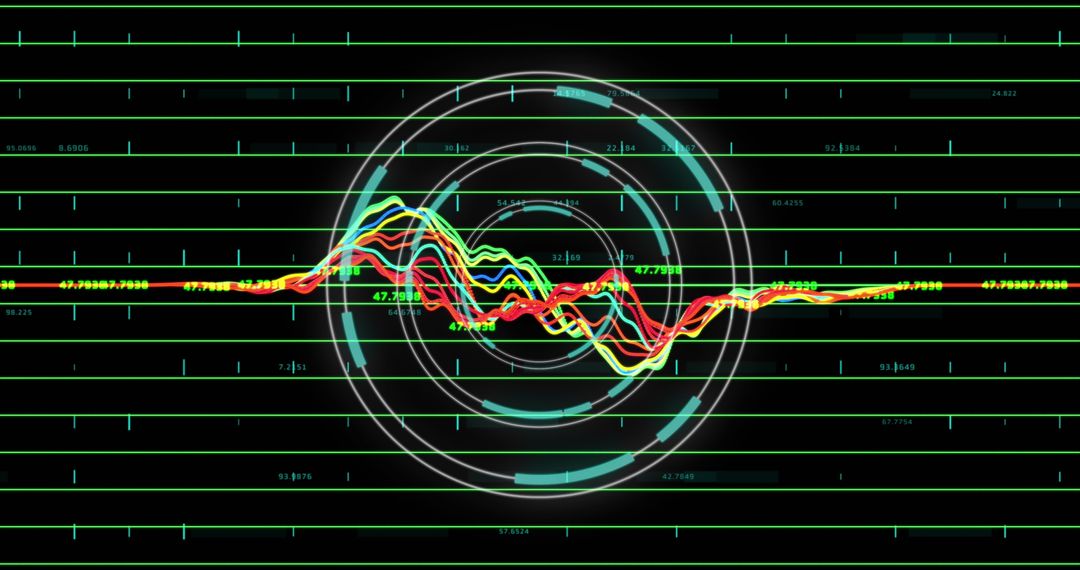
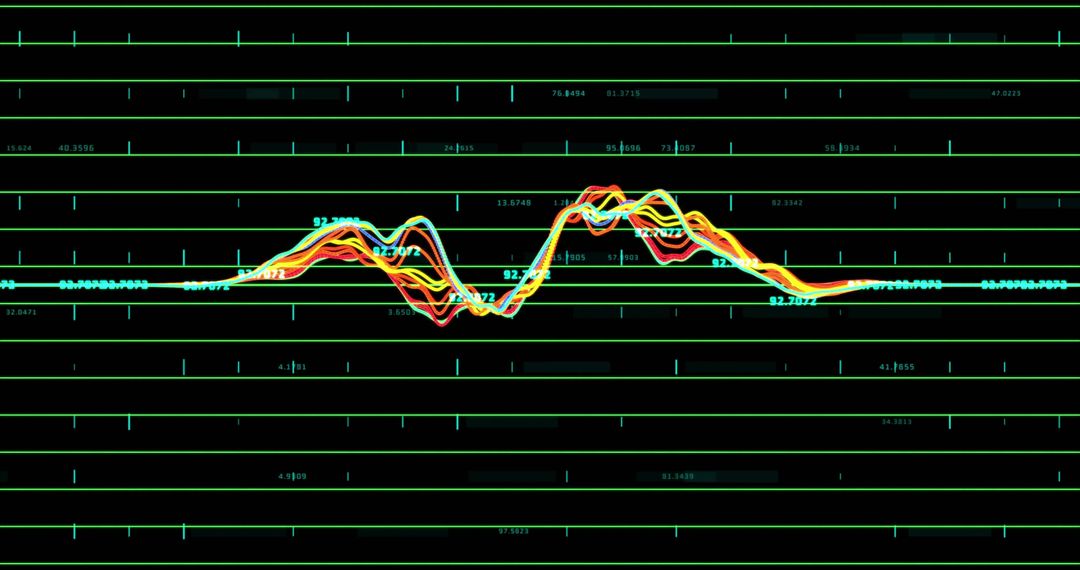
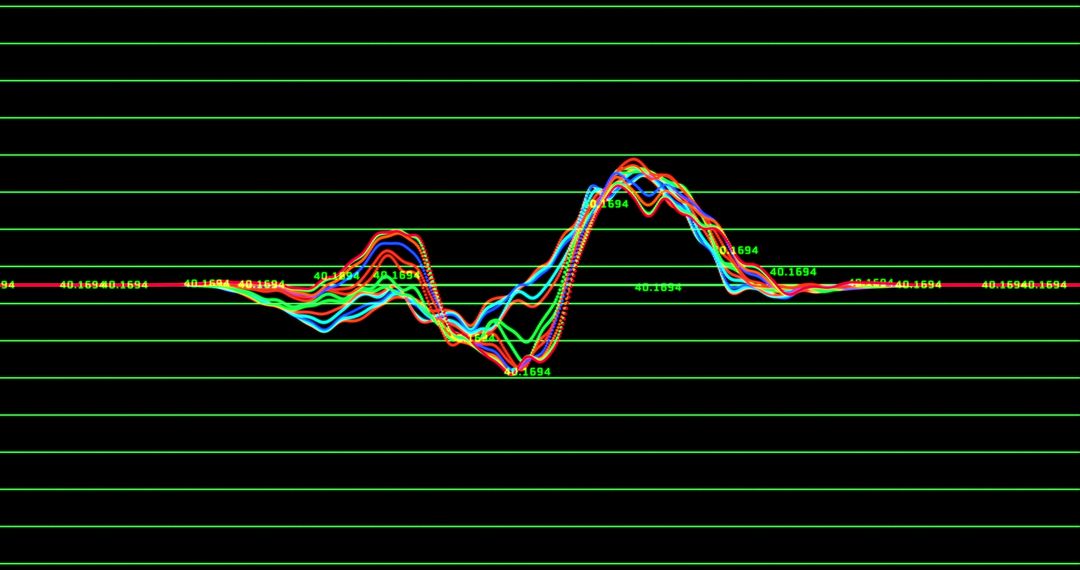
Featuring neon cyan horizontal grid over deep black backdrop, layered multicolor waveform lines oscillating along central axis with angled cyan bars and pixelated numeric readouts (2406) adding technical detail. Bright red, yellow, blue traces overlapping to create dynamic spectrum suggesting signal analysis, telemetry, market trend monitoring or system diagnostics. High-contrast glow and precise grid lines conveying futuristic, cyberpunk tech mood while maintaining clean, data-driven aesthetic. Ideal for tech presentations, analytics dashboards, fintech branding, cybersecurity articles, UI mockups, background for video overlays, website hero banners, and marketing materials seeking modern, high-energy visual impact.
Powered by 


0
downloads
downloads
Tags:
More
Credit Photo
If you would like to credit the Photo, here are some ways you can do so
Text Link
photo Link
<span class="text-link">
<span>
<a target="_blank" href=https://pikwizard.com/photo/displaying-neon-waveform-analytics-hud-showing-colorful-oscillating-data-lines/0423524895a5aca28bd484234a842d74/>PikWizard</a>
</span>
</span>
<span class="image-link">
<span
style="margin: 0 0 20px 0; display: inline-block; vertical-align: middle; width: 100%;"
>
<a
target="_blank"
href="https://pikwizard.com/photo/displaying-neon-waveform-analytics-hud-showing-colorful-oscillating-data-lines/0423524895a5aca28bd484234a842d74/"
style="text-decoration: none; font-size: 10px; margin: 0;"
>
<img src="https://pikwizard.com/pw/medium/0423524895a5aca28bd484234a842d74.jpg" style="margin: 0; width: 100%;" alt="" />
<p style="font-size: 12px; margin: 0;">PikWizard</p>
</a>
</span>
</span>
Free (free of charge)
Free for personal and commercial use.
Author: People Creations
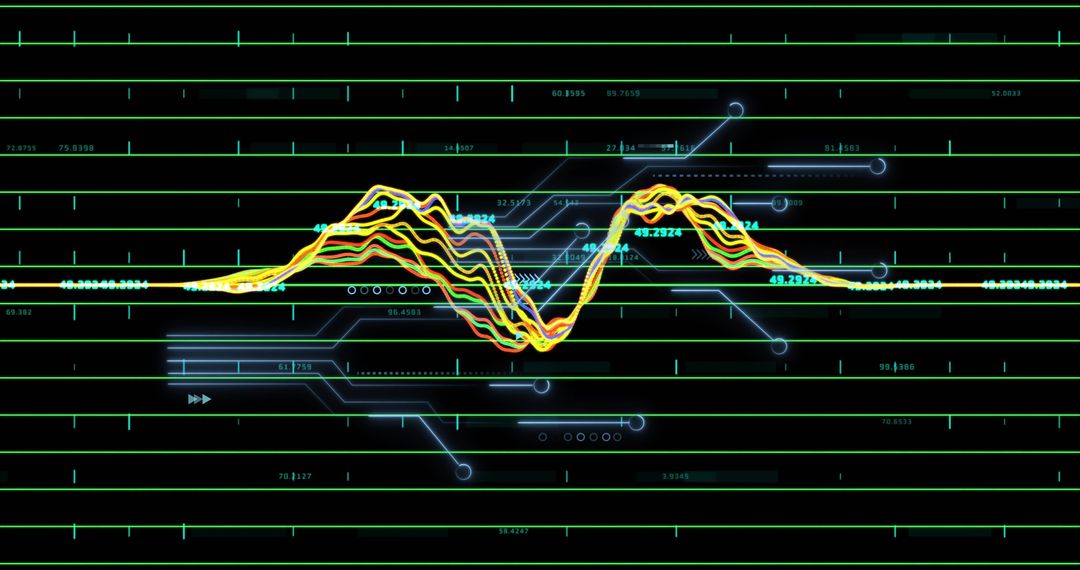
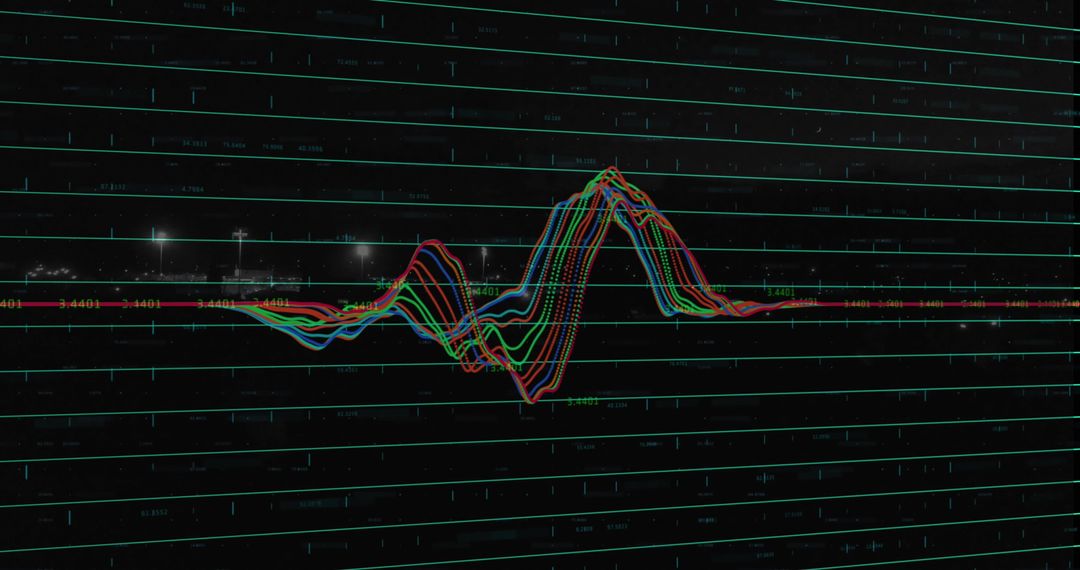
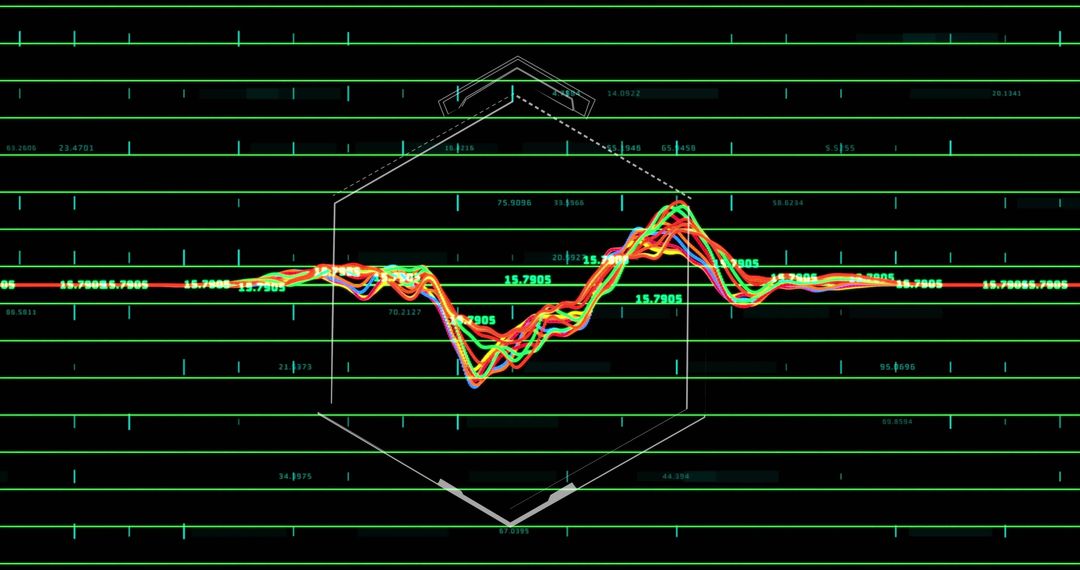
Similar Free Stock Images
Premium


Premium


Premium


Premium


Premium


Premium


Premium


Premium


Premium


Premium


Premium


Premium


Premium


Premium


Premium


Premium


Premium


Premium


Premium


Premium


Premium


Premium


Premium


Premium