
- Home >
- Stock Photos >
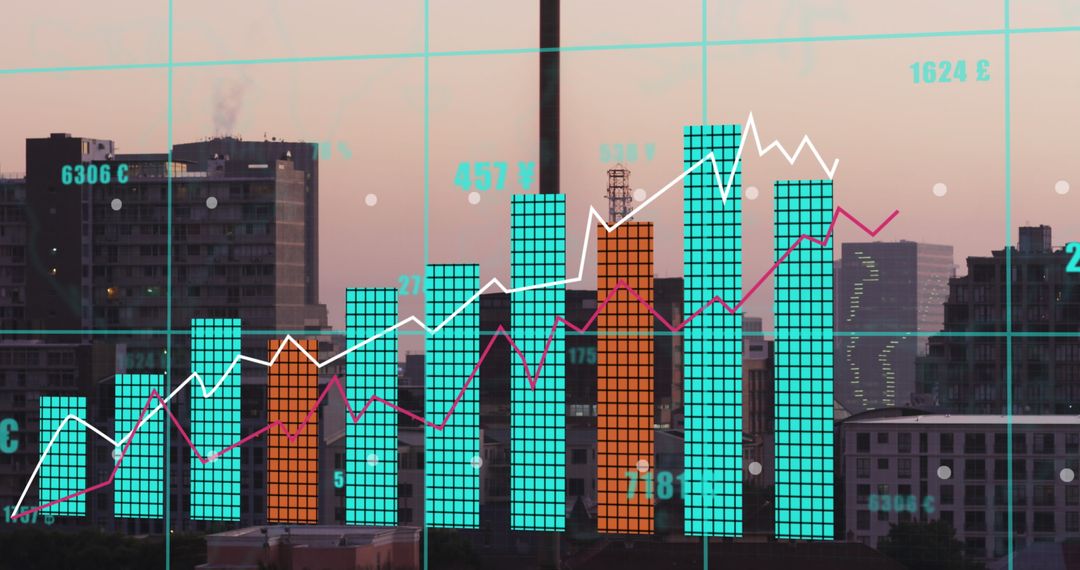
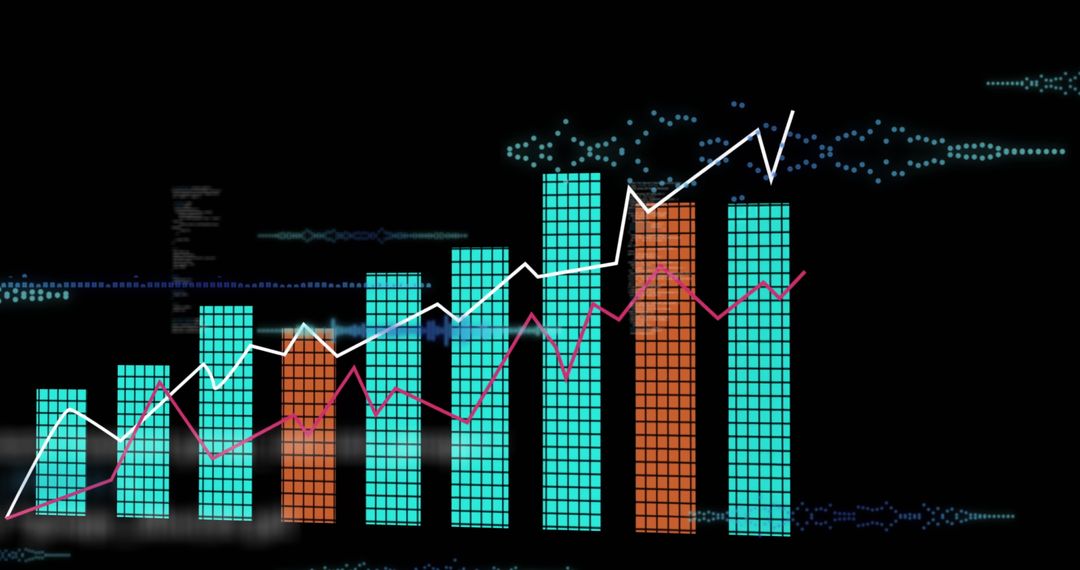
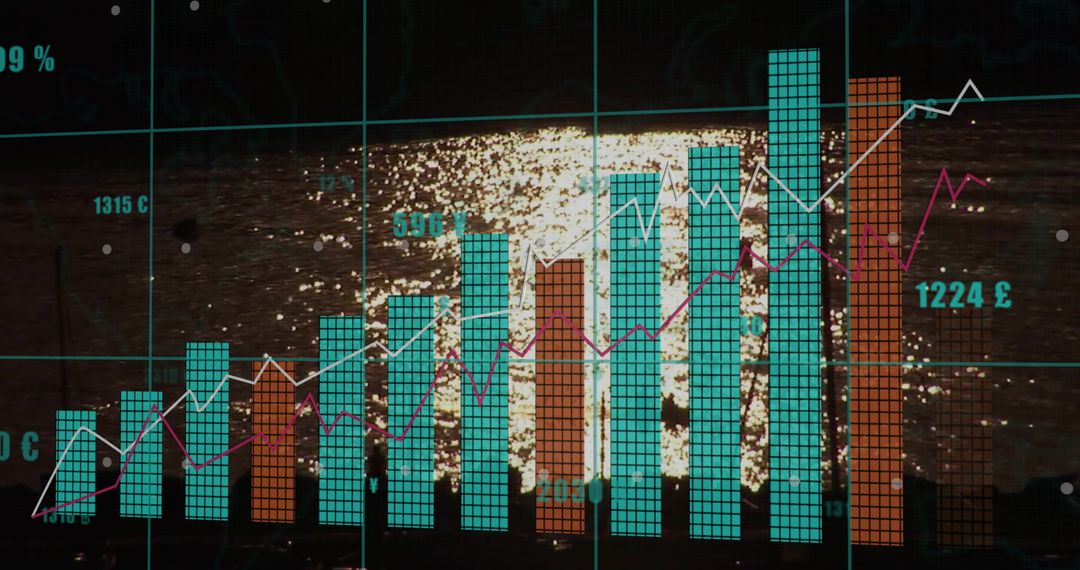
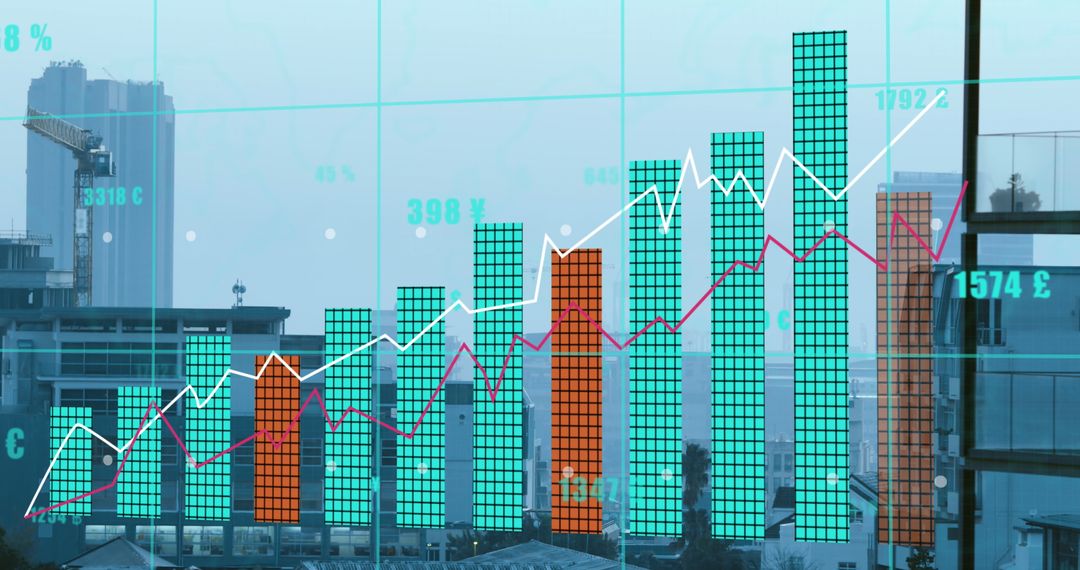
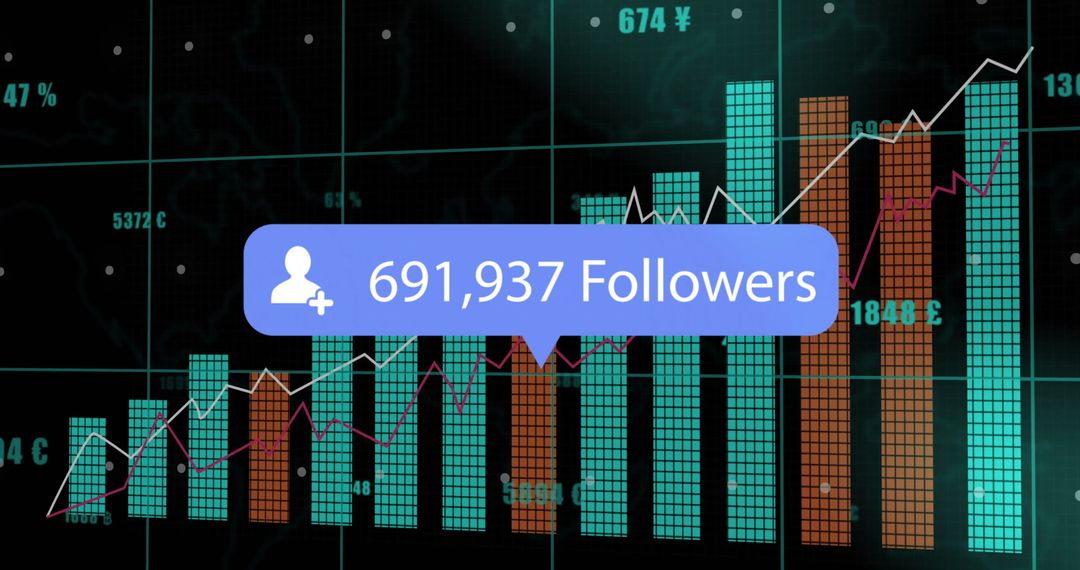
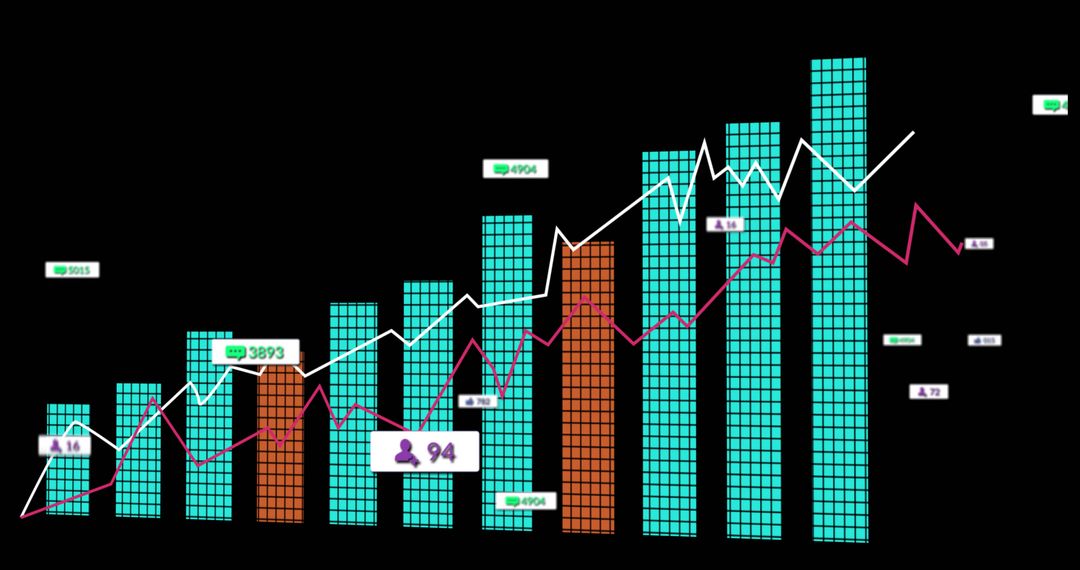
- Displaying Vertical Bar Chart on Night Dashboard with Rising Trend Lines and City Skyline
Displaying Vertical Bar Chart on Night Dashboard with Rising Trend Lines and City Skyline Image

Showing tall turquoise and orange vertical bars with white and magenta trend lines layered over blurred urban night skyline and grid overlay. Ideal for illustrating financial growth, market analysis, revenue forecasting, currency exchange, and fintech solutions. Suitable for use in corporate presentations, investor reports, website hero banners, startup pitch decks, blog headers, social media campaigns, and educational materials about data literacy. Offering modern, high-tech aesthetic that works well for backgrounds, overlays, headline visuals, and custom data callouts.
Powered by 


0
downloads
downloads
Tags:
More
Credit Photo
If you would like to credit the Photo, here are some ways you can do so
Text Link
photo Link
<span class="text-link">
<span>
<a target="_blank" href=https://pikwizard.com/photo/displaying-vertical-bar-chart-on-night-dashboard-with-rising-trend-lines-and-city-skyline/1516f3997698c1f960c6671d3206ab26/>PikWizard</a>
</span>
</span>
<span class="image-link">
<span
style="margin: 0 0 20px 0; display: inline-block; vertical-align: middle; width: 100%;"
>
<a
target="_blank"
href="https://pikwizard.com/photo/displaying-vertical-bar-chart-on-night-dashboard-with-rising-trend-lines-and-city-skyline/1516f3997698c1f960c6671d3206ab26/"
style="text-decoration: none; font-size: 10px; margin: 0;"
>
<img src="https://pikwizard.com/pw/medium/1516f3997698c1f960c6671d3206ab26.jpg" style="margin: 0; width: 100%;" alt="" />
<p style="font-size: 12px; margin: 0;">PikWizard</p>
</a>
</span>
</span>
Free (free of charge)
Free for personal and commercial use.
Author: Awesome Content
Similar Free Stock Images
Premium


Premium


Premium


Premium


Premium


Premium


Premium


Premium


Premium


Premium


Premium


Premium


Premium


Premium


Premium


Premium


Premium


Premium


Premium


Premium


Premium


Premium


Premium


Premium


Premium

