- Home >
- Stock Photos >
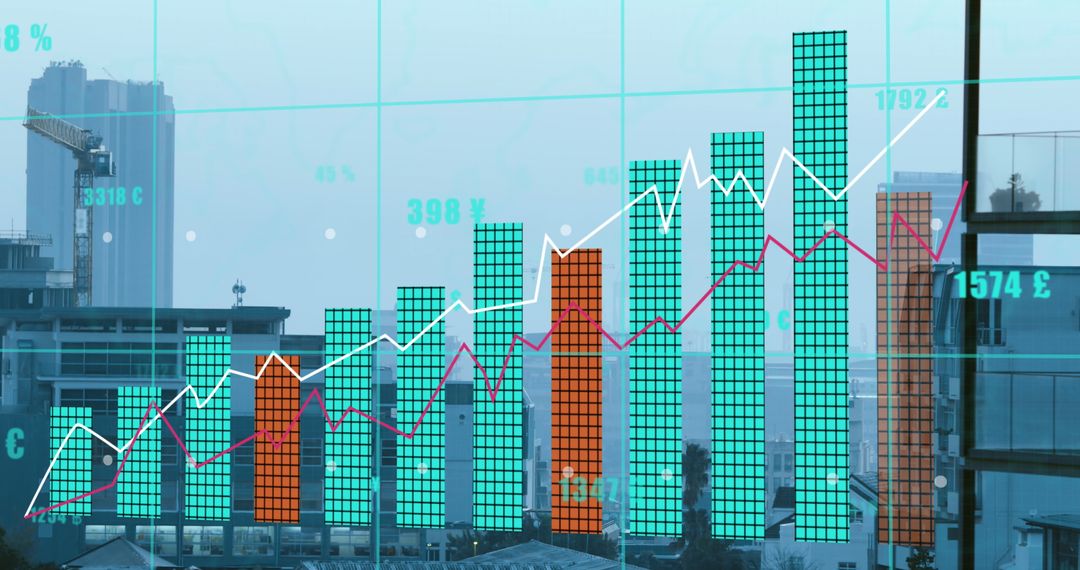
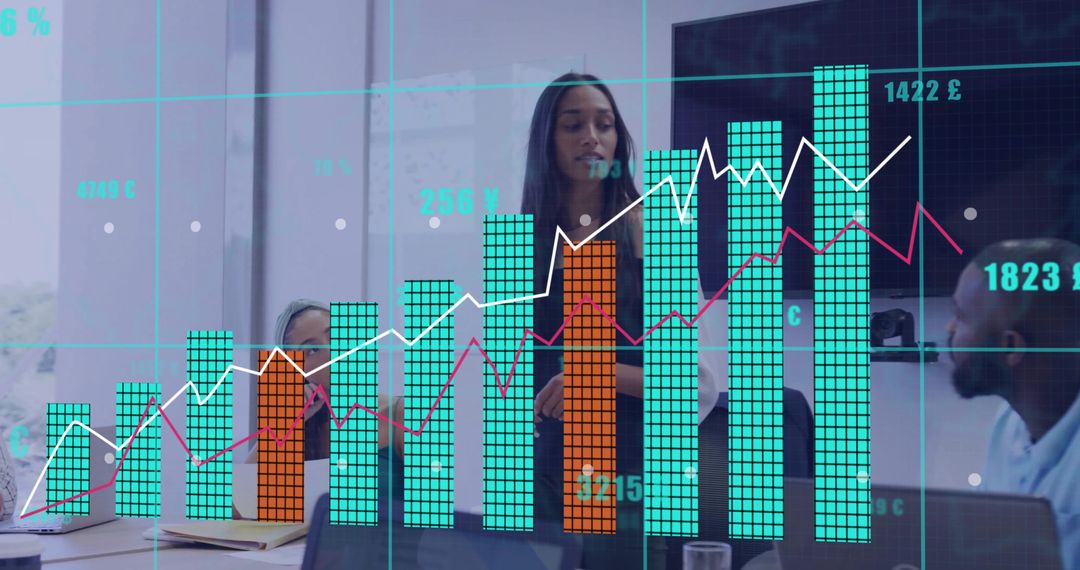
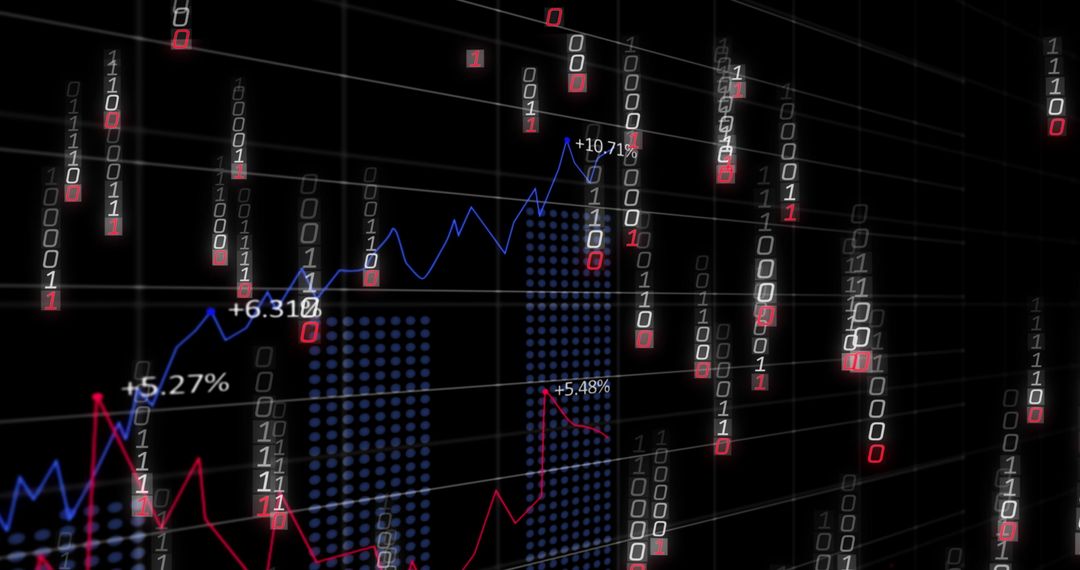
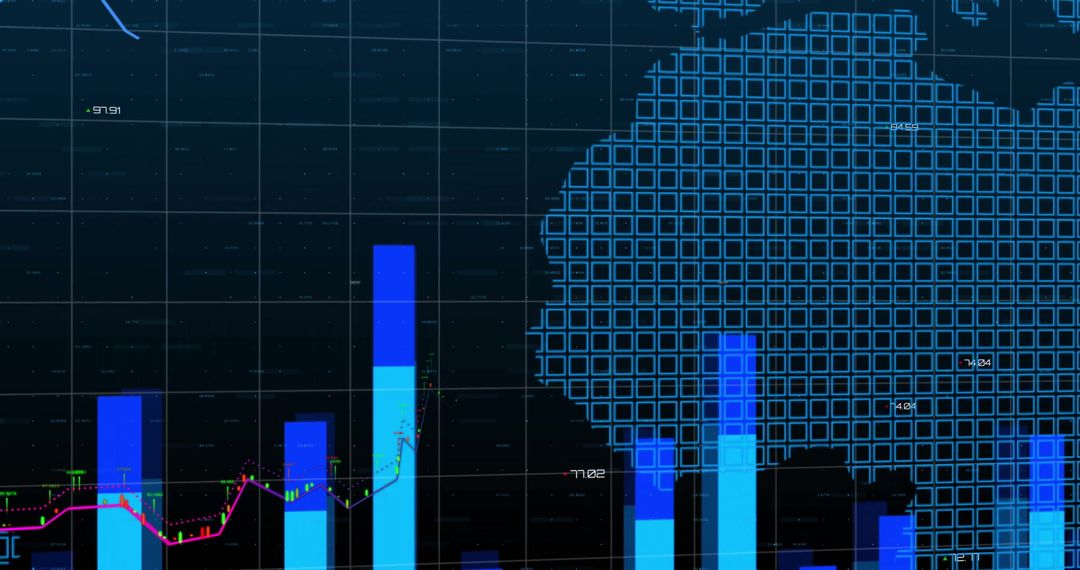
- Diverse Businesspeople Analyzing Financial Data Charts Digital Background
Diverse Businesspeople Analyzing Financial Data Charts Digital Background Image

Diverse business professionals engage in analyzing digitally generated financial data. Various financial graphs illustrate stock market trends, growth and investment strategies. This versatile image can be used for articles about corporate finance, stock market analysis, financial technologies, or business strategies, illustrating the dynamic nature of the financial sector.
Powered by  - Get 15% off with code: PIKWIZARD15


2
downloads
downloads
Tags:
More
Credit Photo
If you would like to credit the Photo, here are some ways you can do so
Text Link
photo Link
<span class="text-link">
<span>
<a target="_blank" href=https://pikwizard.com/photo/diverse-businesspeople-analyzing-financial-data-charts-digital-background/545ba80601aa3a7b883e968d0a30e3b9/>PikWizard</a>
</span>
</span>
<span class="image-link">
<span
style="margin: 0 0 20px 0; display: inline-block; vertical-align: middle; width: 100%;"
>
<a
target="_blank"
href="https://pikwizard.com/photo/diverse-businesspeople-analyzing-financial-data-charts-digital-background/545ba80601aa3a7b883e968d0a30e3b9/"
style="text-decoration: none; font-size: 10px; margin: 0;"
>
<img src="https://pikwizard.com/pw/medium/545ba80601aa3a7b883e968d0a30e3b9.jpg" style="margin: 0; width: 100%;" alt="" />
<p style="font-size: 12px; margin: 0;">PikWizard</p>
</a>
</span>
</span>
Free (free of charge)
Free for personal and commercial use.
Author: Awesome Content
Similar Free Stock Images

Premium


Premium


Premium


Premium


Premium


Premium


Premium


Premium


Premium


Premium


Premium


Premium


Premium


Premium


Premium


Premium


Premium


Premium


Premium


Premium


Premium


Premium


Premium


Premium