- Home >
- Stock Photos >
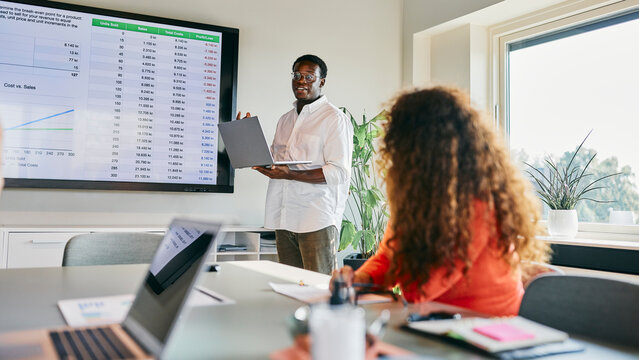
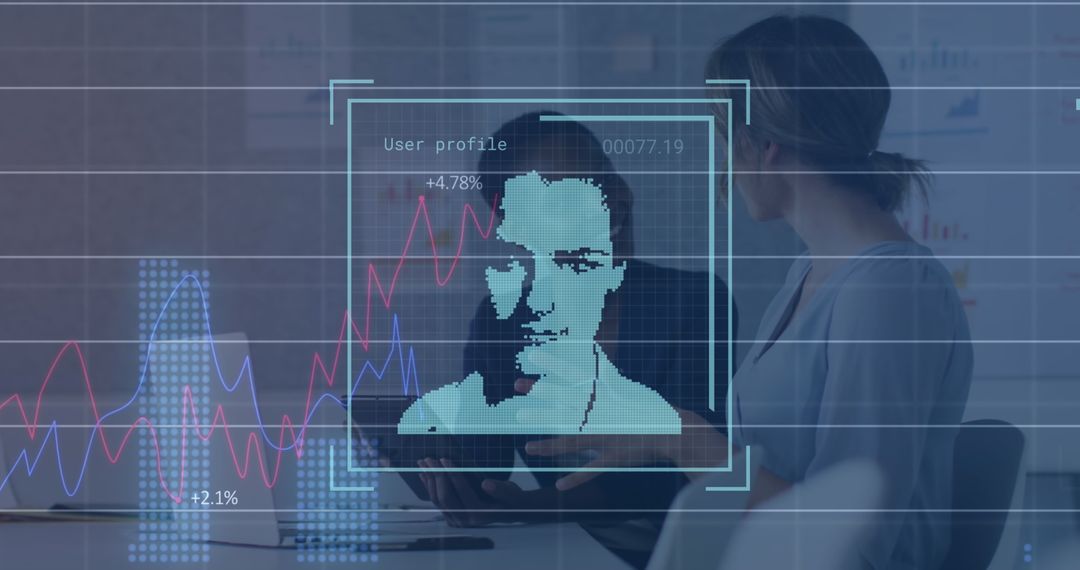
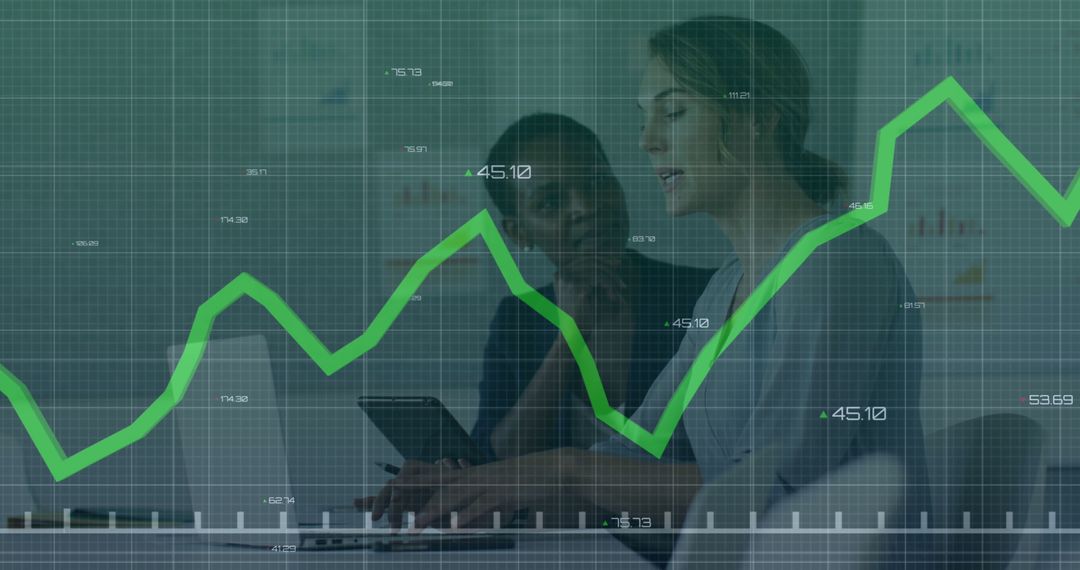
- Diverse Co-Workers Analyzing Financial Data on Laptop in Modern Office
Diverse Co-Workers Analyzing Financial Data on Laptop in Modern Office Image
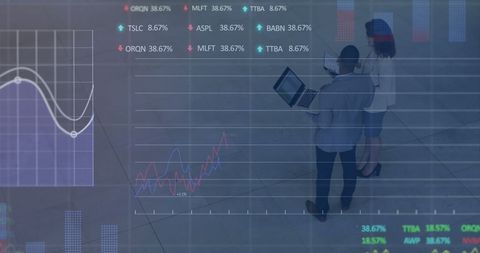
Two diverse coworkers collaborating in a modern office environment, examining financial data displayed on a laptop. Financial graphs and market statistics overlay contribute to an impression of advanced business analysis and strategic decision-making. Perfect for use in business presentations, articles about corporate finance, teamwork, or investment strategies.
Powered by 


2
downloads
downloads
Tags:
More
Credit Photo
If you would like to credit the Photo, here are some ways you can do so
Text Link
photo Link
<span class="text-link">
<span>
<a target="_blank" href=https://pikwizard.com/photo/diverse-co-workers-analyzing-financial-data-on-laptop-in-modern-office/a61c5041dbb9e462bee292b9dc3f2d99/>PikWizard</a>
</span>
</span>
<span class="image-link">
<span
style="margin: 0 0 20px 0; display: inline-block; vertical-align: middle; width: 100%;"
>
<a
target="_blank"
href="https://pikwizard.com/photo/diverse-co-workers-analyzing-financial-data-on-laptop-in-modern-office/a61c5041dbb9e462bee292b9dc3f2d99/"
style="text-decoration: none; font-size: 10px; margin: 0;"
>
<img src="https://pikwizard.com/pw/medium/a61c5041dbb9e462bee292b9dc3f2d99.jpg" style="margin: 0; width: 100%;" alt="" />
<p style="font-size: 12px; margin: 0;">PikWizard</p>
</a>
</span>
</span>
Free (free of charge)
Free for personal and commercial use.
Author: People Creations
Similar Free Stock Images

Premium


Premium


Premium


Premium


Premium


Premium


Premium


Premium


Premium


Premium


Premium


Premium


Premium


Premium


Premium


Premium


Premium


Premium


Premium


Premium


Premium


Premium


Premium


Premium