- Home >
- Stock Photos >
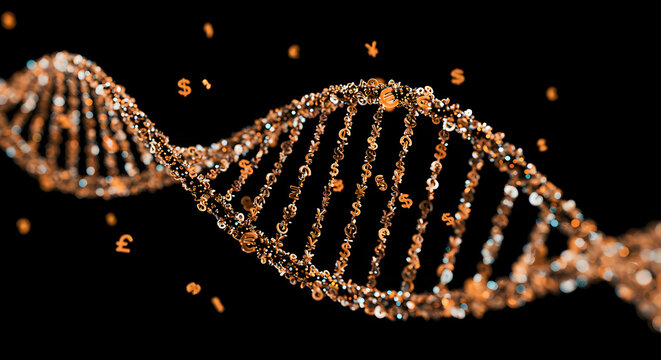
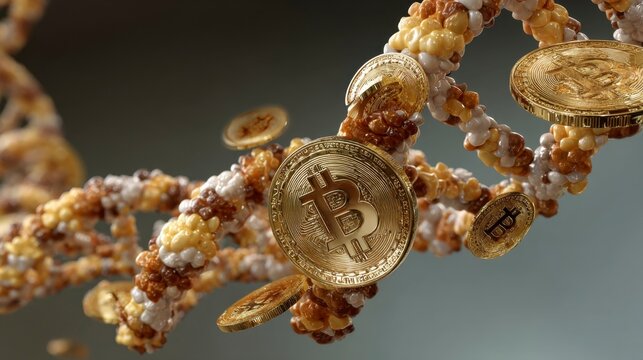
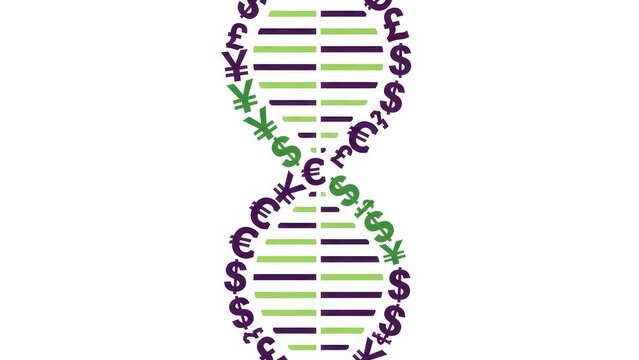
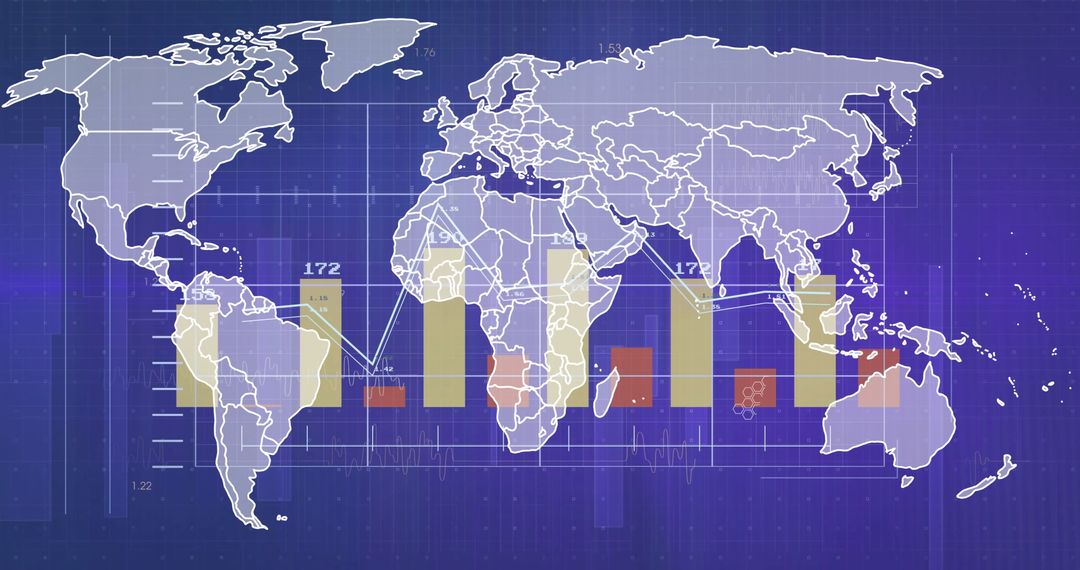
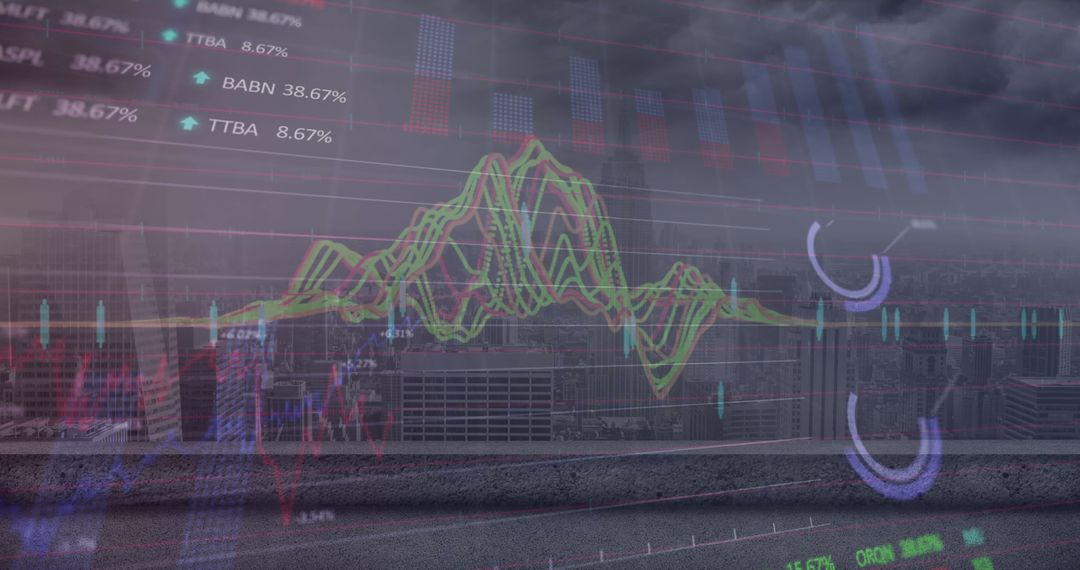
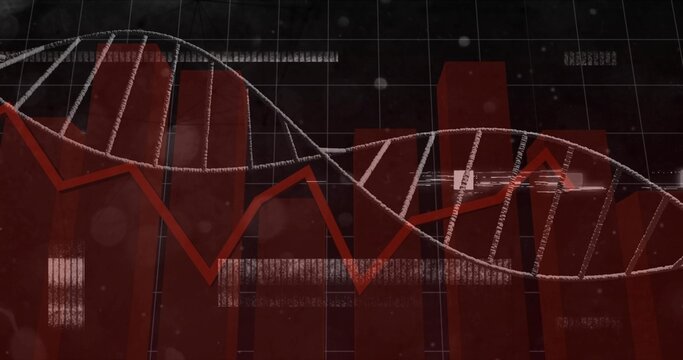
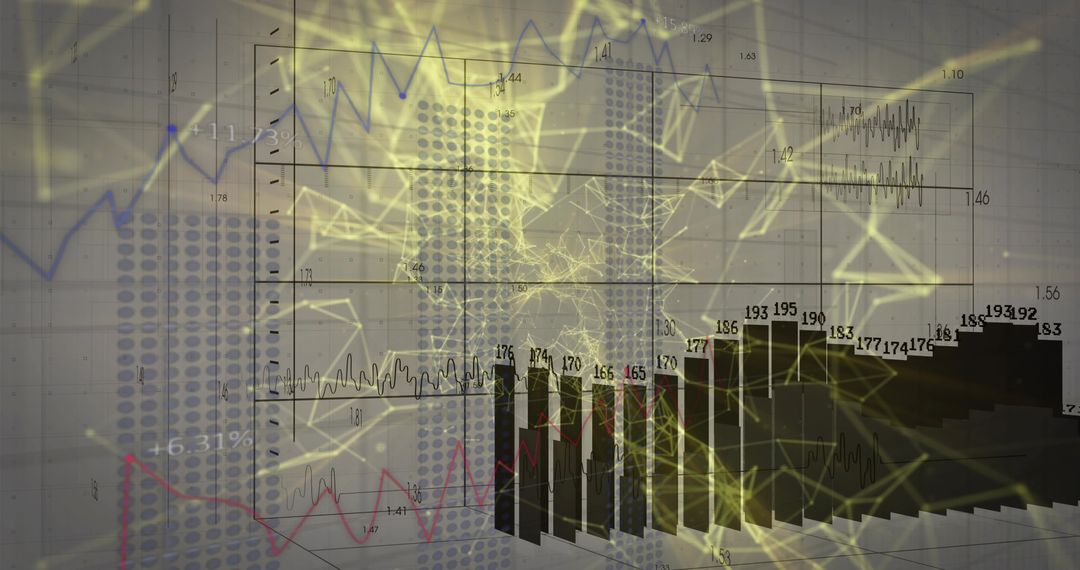
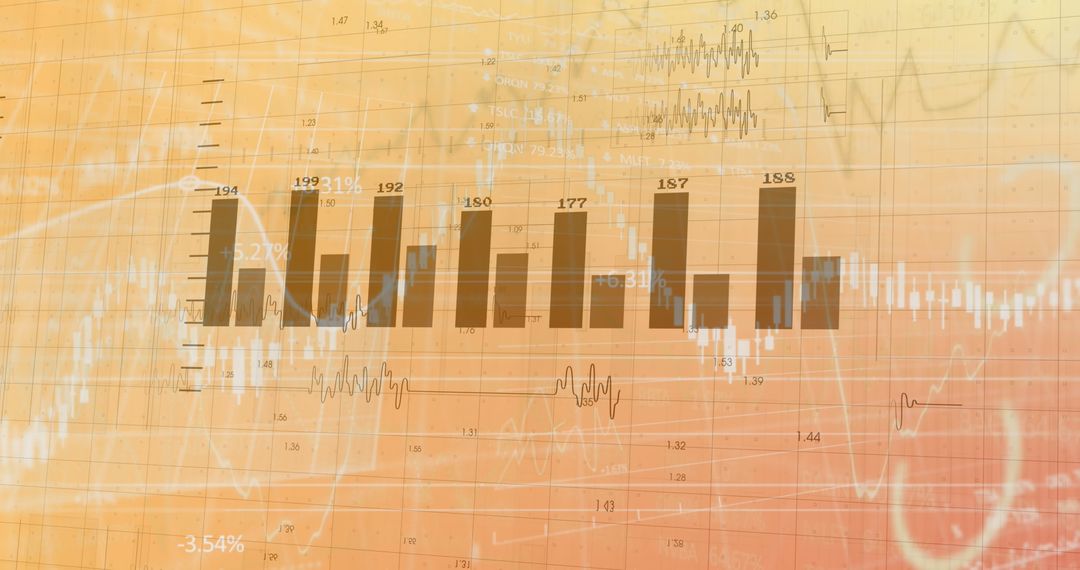
- DNA Strand Merging with Financial Charts and Data
DNA Strand Merging with Financial Charts and Data Image

This conceptual artwork depicting a DNA strand intertwined with financial charts symbolizes the intersection of genetics and financial technology. Suitably leveraged for infographics relating to bioinformatics, biotechnology in finance, or data-driven scientific research. This abstract visual assists in presentations and reports emphasizing innovation at the crossroads of science and equity analysis.
Powered by 


3
downloads
downloads
Tags:
More
Credit Photo
If you would like to credit the Photo, here are some ways you can do so
Text Link
photo Link
<span class="text-link">
<span>
<a target="_blank" href=https://pikwizard.com/photo/dna-strand-merging-with-financial-charts-and-data/8a148ae7f0980d7a8910e408e8c0a462/>PikWizard</a>
</span>
</span>
<span class="image-link">
<span
style="margin: 0 0 20px 0; display: inline-block; vertical-align: middle; width: 100%;"
>
<a
target="_blank"
href="https://pikwizard.com/photo/dna-strand-merging-with-financial-charts-and-data/8a148ae7f0980d7a8910e408e8c0a462/"
style="text-decoration: none; font-size: 10px; margin: 0;"
>
<img src="https://pikwizard.com/pw/medium/8a148ae7f0980d7a8910e408e8c0a462.jpg" style="margin: 0; width: 100%;" alt="" />
<p style="font-size: 12px; margin: 0;">PikWizard</p>
</a>
</span>
</span>
Free (free of charge)
Free for personal and commercial use.
Author: Awesome Content
Similar Free Stock Images
Premium


Premium


Premium


Premium


Premium


Premium


Premium


Premium


Premium


Premium


Premium


Premium


Premium


Premium


Premium


Premium


Premium


Premium


Premium


Premium


Premium


Premium


Premium


Premium