- Home >
- Stock Photos >
- Doctor Analyzing COVID-19 Data with Holographic Charts
Doctor Analyzing COVID-19 Data with Holographic Charts Image
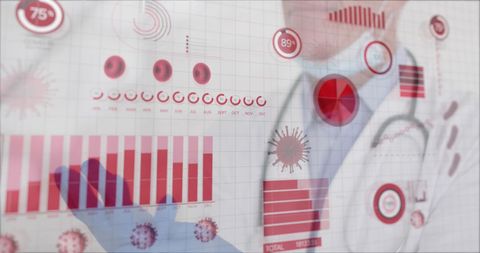
Visual depicts a doctor interacting with digital interfaces displaying statistical data and COVID-19 virus symbols. Ideal for use in articles on healthcare technology, pandemic studies, and data visualization in medical settings.
Powered by  - Get 15% off with code: PIKWIZARD15


2
downloads
downloads
Tags:
More
Credit Photo
If you would like to credit the Photo, here are some ways you can do so
Text Link
photo Link
<span class="text-link">
<span>
<a target="_blank" href=https://pikwizard.com/photo/doctor-analyzing-covid-19-data-with-holographic-charts/515b8a1bfaf33da163d46abbcd416175/>PikWizard</a>
</span>
</span>
<span class="image-link">
<span
style="margin: 0 0 20px 0; display: inline-block; vertical-align: middle; width: 100%;"
>
<a
target="_blank"
href="https://pikwizard.com/photo/doctor-analyzing-covid-19-data-with-holographic-charts/515b8a1bfaf33da163d46abbcd416175/"
style="text-decoration: none; font-size: 10px; margin: 0;"
>
<img src="https://pikwizard.com/pw/medium/515b8a1bfaf33da163d46abbcd416175.jpg" style="margin: 0; width: 100%;" alt="" />
<p style="font-size: 12px; margin: 0;">PikWizard</p>
</a>
</span>
</span>
Free (free of charge)
Free for personal and commercial use.
Author: Authentic Images
Similar Free Stock Images

Premium


Premium


Premium


Premium


Premium


Premium


Premium


Premium


Premium


Premium


Premium


Premium


Premium


Premium


Premium


Premium


Premium


Premium


Premium


Premium


Premium


Premium


Premium


Premium


Premium