- Home >
- Stock Photos >
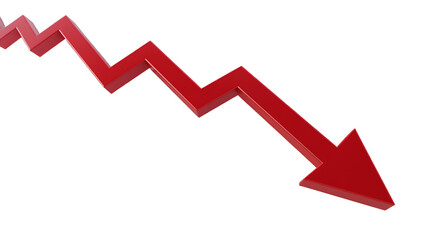
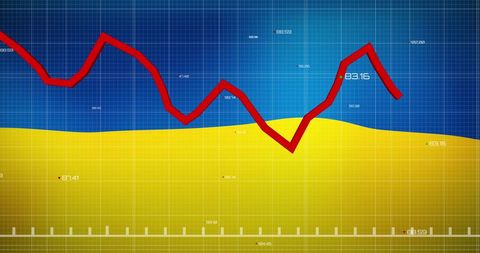
- Downward Red Arrow on Gradient Background Representing Economic Decline
Downward Red Arrow on Gradient Background Representing Economic Decline Image

An image featuring a jagged red arrow pointing downward against a gradient blue background symbolizes economic decline and negative market trends. Useful for illustrating financial reports, business analysis, risk assessment, investment strategy presentations, or educational materials on economic impacts.
Powered by 


2
downloads
downloads
Tags:
More
Credit Photo
If you would like to credit the Photo, here are some ways you can do so
Text Link
photo Link
<span class="text-link">
<span>
<a target="_blank" href=https://pikwizard.com/photo/downward-red-arrow-on-gradient-background-representing-economic-decline/3141d352510a60d443127408524036ae/>PikWizard</a>
</span>
</span>
<span class="image-link">
<span
style="margin: 0 0 20px 0; display: inline-block; vertical-align: middle; width: 100%;"
>
<a
target="_blank"
href="https://pikwizard.com/photo/downward-red-arrow-on-gradient-background-representing-economic-decline/3141d352510a60d443127408524036ae/"
style="text-decoration: none; font-size: 10px; margin: 0;"
>
<img src="https://pikwizard.com/pw/medium/3141d352510a60d443127408524036ae.jpg" style="margin: 0; width: 100%;" alt="" />
<p style="font-size: 12px; margin: 0;">PikWizard</p>
</a>
</span>
</span>
Free (free of charge)
Free for personal and commercial use.
Author: Awesome Content
Similar Free Stock Images

Premium


Premium


Premium


Premium


Premium


Premium


Premium


Premium


Premium


Premium


Premium


Premium


Premium


Premium


Premium


Premium


Premium


Premium


Premium


Premium


Premium


Premium


Premium


Premium


Premium