- Home >
- Stock Photos >
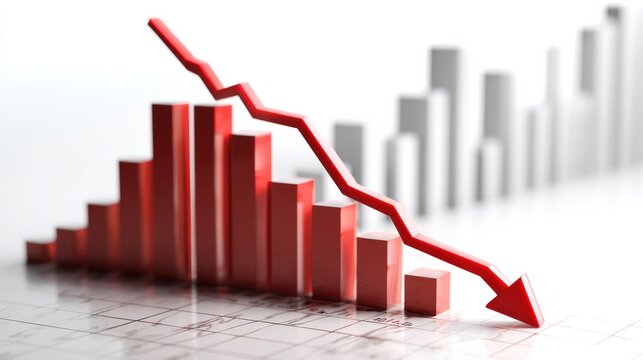
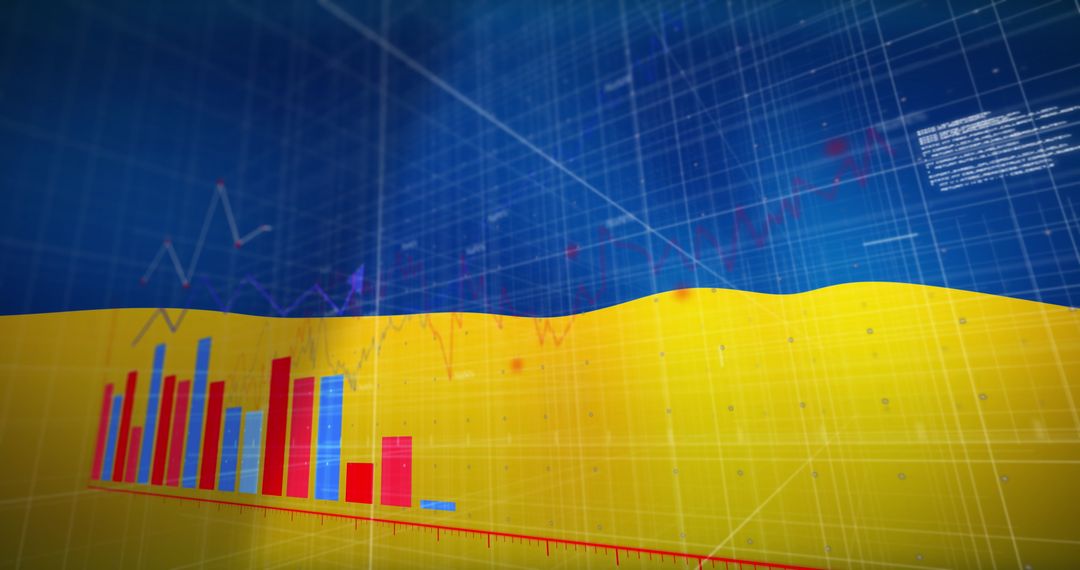
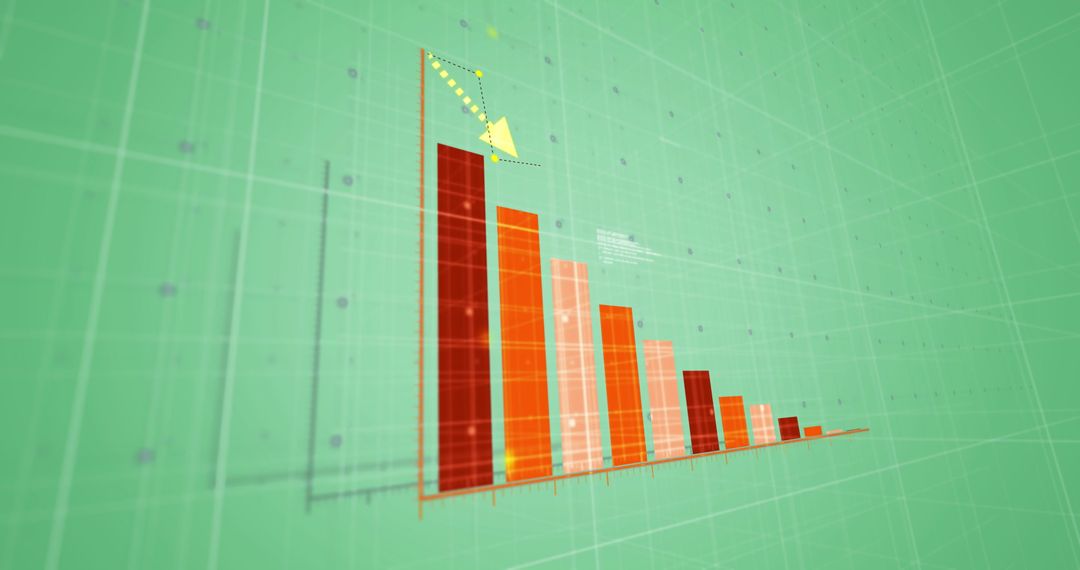
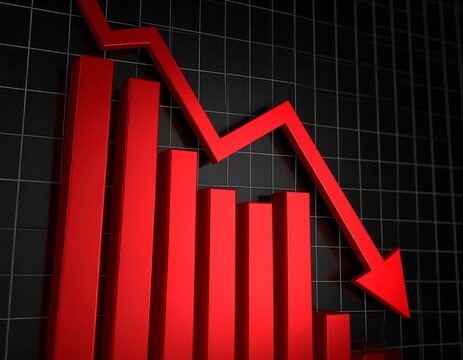
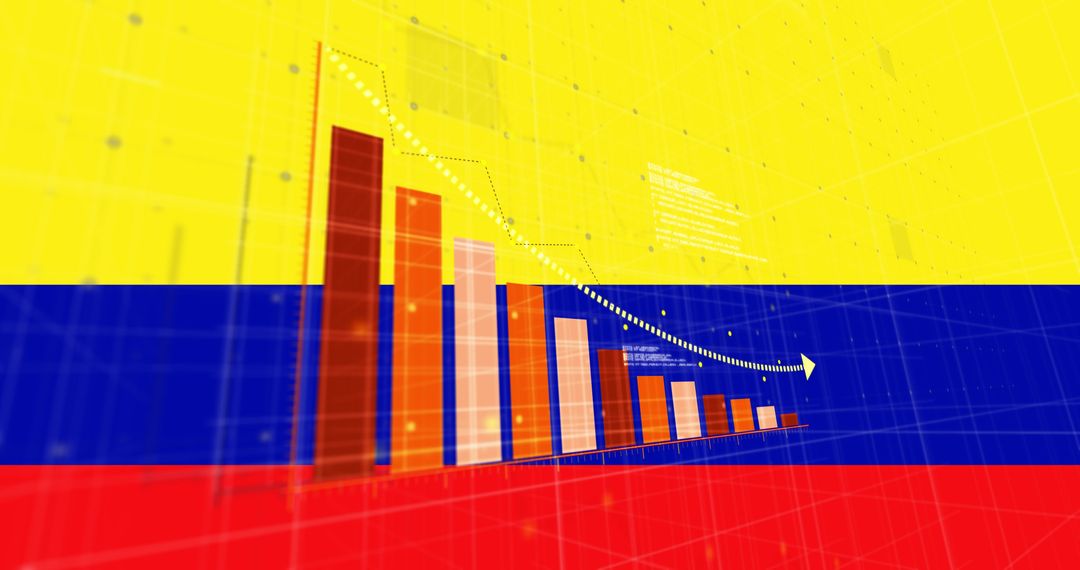
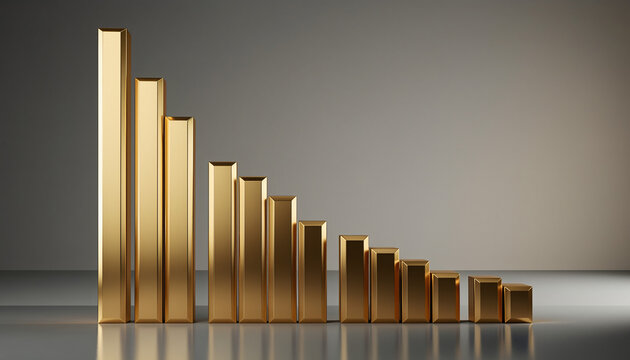
- Dynamic Bar Graph with Downward Trend on Red Grid Background
Dynamic Bar Graph with Downward Trend on Red Grid Background Image

Creative depiction of a bar graph with descending values, set against a red grid background. Represents evolving financial trends, business analytics, or statistics. Ideal for use in presentations about market analysis, financial reports, or educational content about economics, offering a visually striking way to convey complex data trends.
Powered by 


2
downloads
downloads
Tags:
More
Credit Photo
If you would like to credit the Photo, here are some ways you can do so
Text Link
photo Link
<span class="text-link">
<span>
<a target="_blank" href=https://pikwizard.com/photo/dynamic-bar-graph-with-downward-trend-on-red-grid-background/4477ac14a0f39ae9b9b6cf84ca6943b8/>PikWizard</a>
</span>
</span>
<span class="image-link">
<span
style="margin: 0 0 20px 0; display: inline-block; vertical-align: middle; width: 100%;"
>
<a
target="_blank"
href="https://pikwizard.com/photo/dynamic-bar-graph-with-downward-trend-on-red-grid-background/4477ac14a0f39ae9b9b6cf84ca6943b8/"
style="text-decoration: none; font-size: 10px; margin: 0;"
>
<img src="https://pikwizard.com/pw/medium/4477ac14a0f39ae9b9b6cf84ca6943b8.jpg" style="margin: 0; width: 100%;" alt="" />
<p style="font-size: 12px; margin: 0;">PikWizard</p>
</a>
</span>
</span>
Free (free of charge)
Free for personal and commercial use.
Author: Awesome Content
Similar Free Stock Images

Premium


Premium


Premium


Premium


Premium


Premium


Premium


Premium


Premium


Premium


Premium


Premium


Premium


Premium


Premium


Premium


Premium


Premium


Premium


Premium


Premium


Premium


Premium


Premium