- Home >
- Stock Photos >
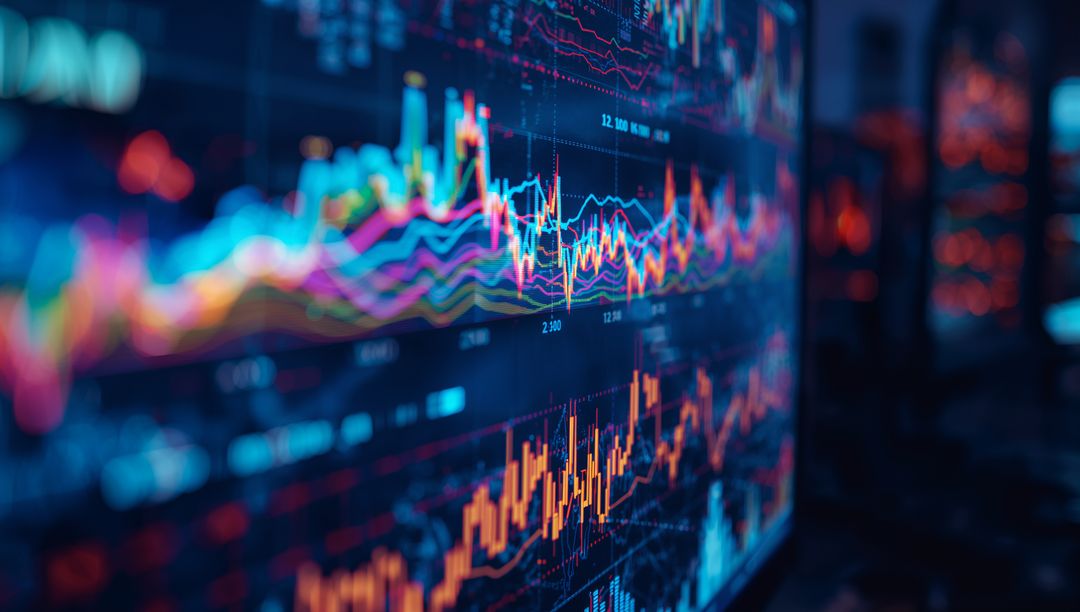
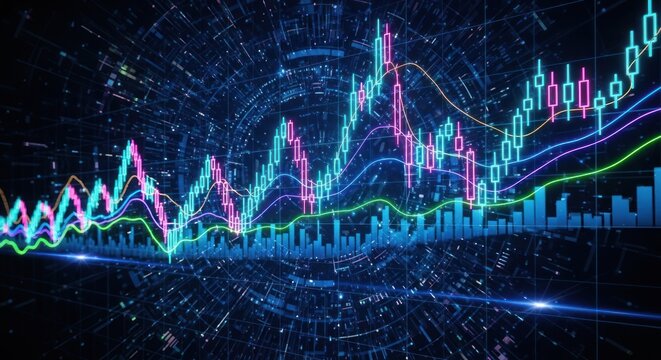
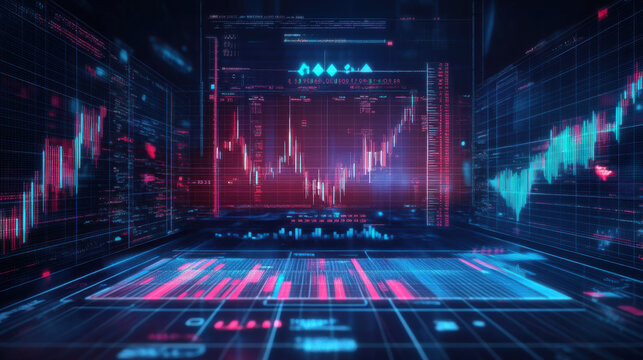
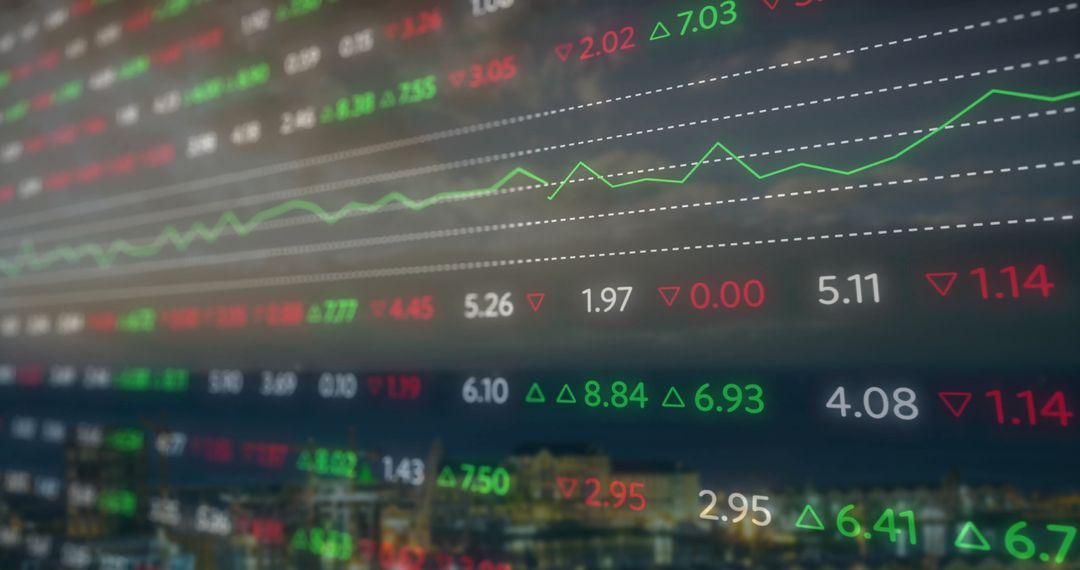
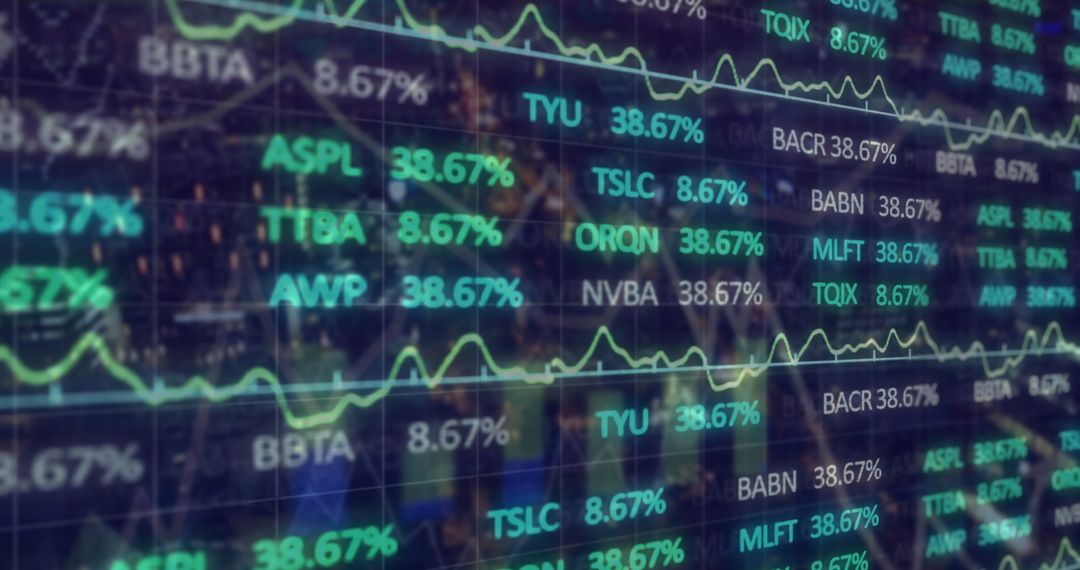
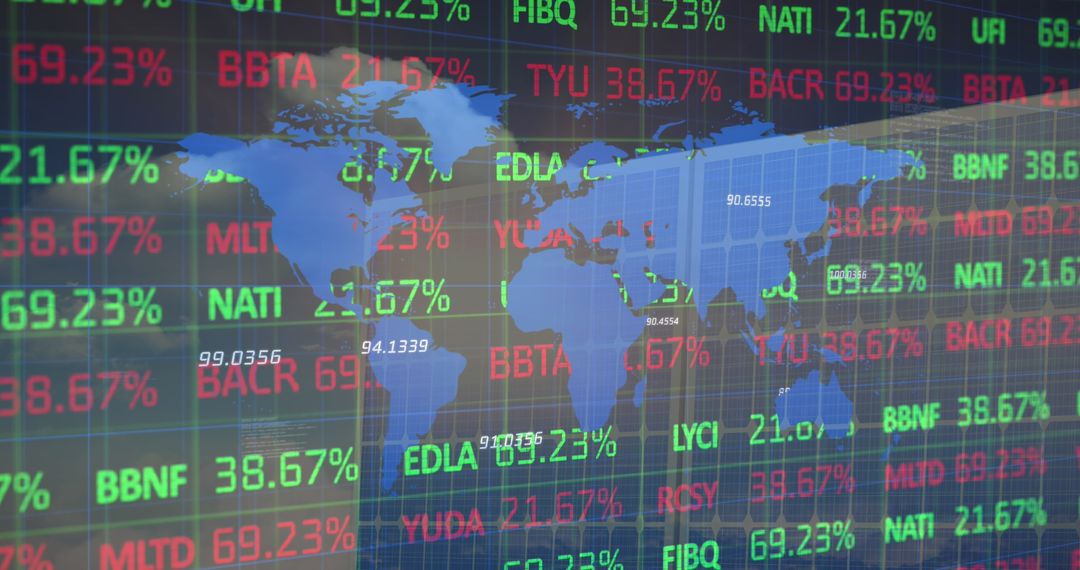
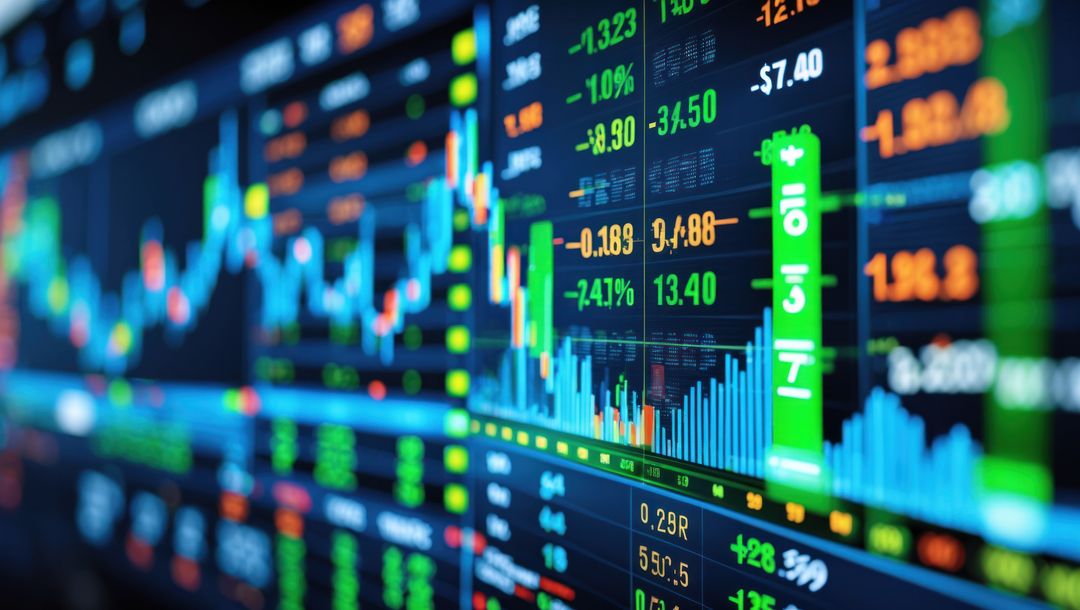
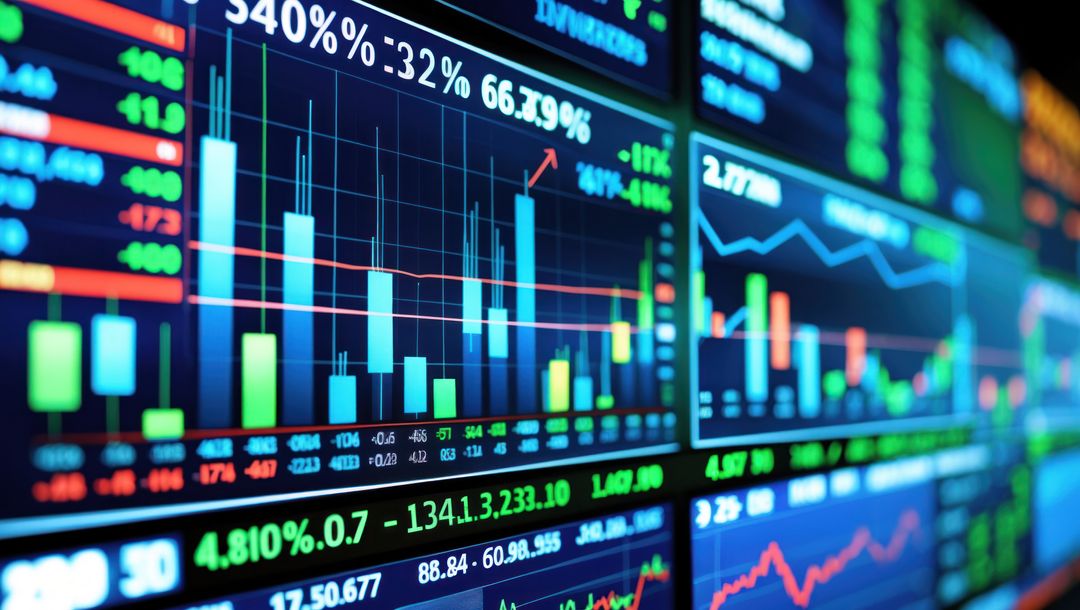
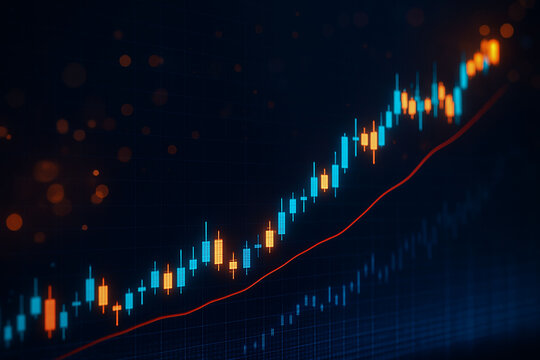
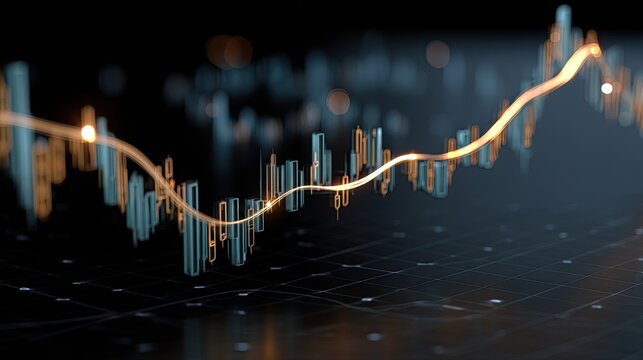
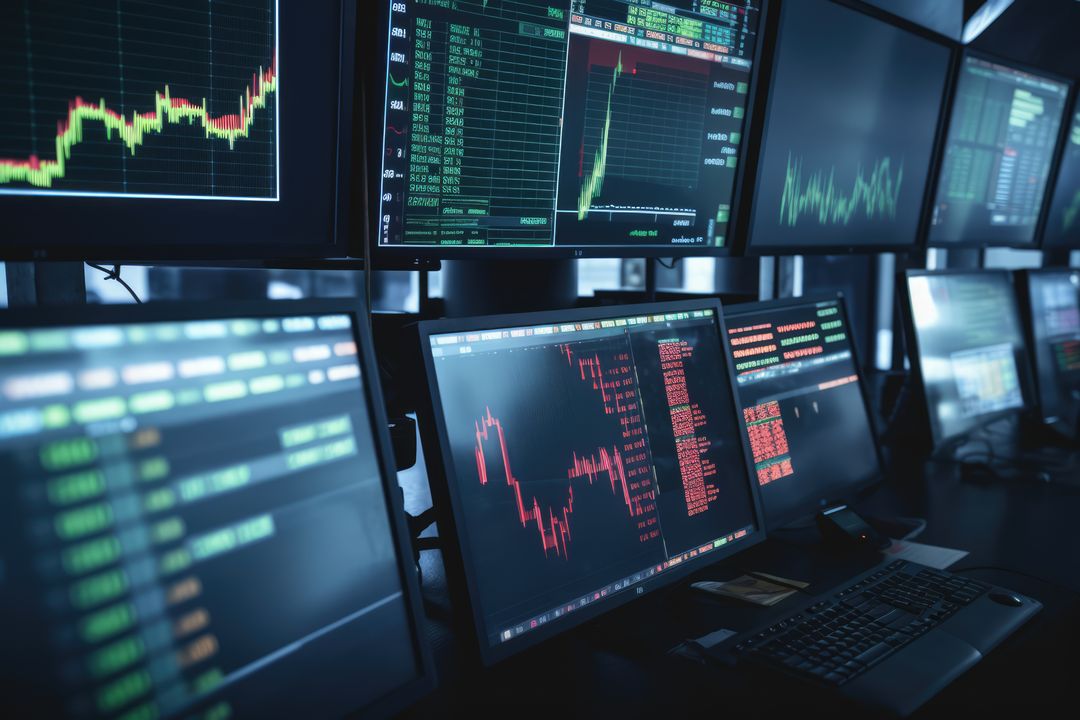
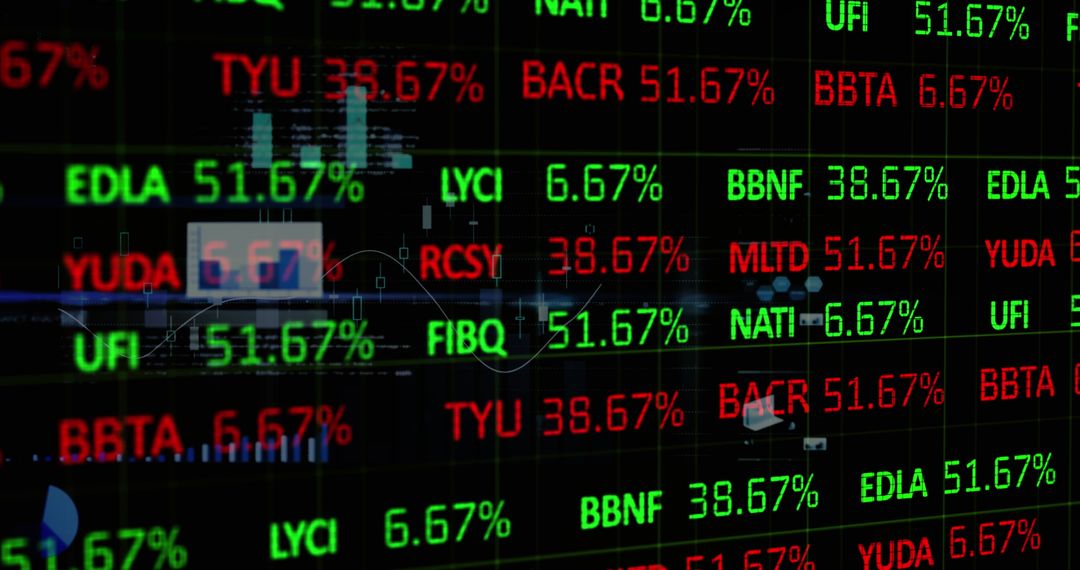
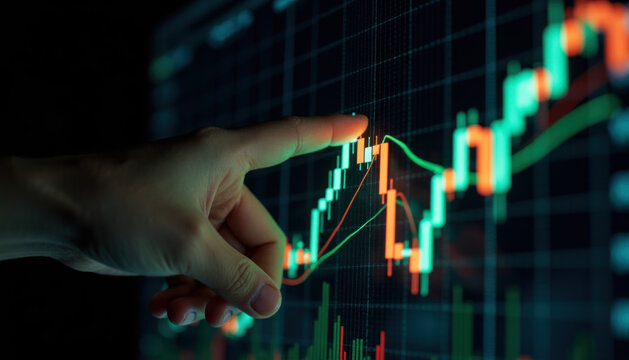
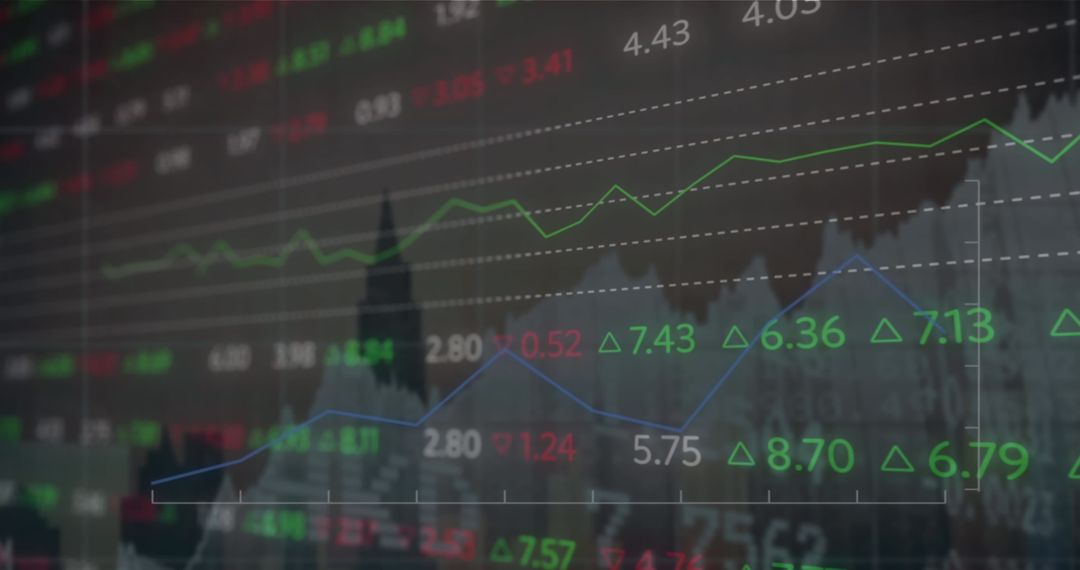
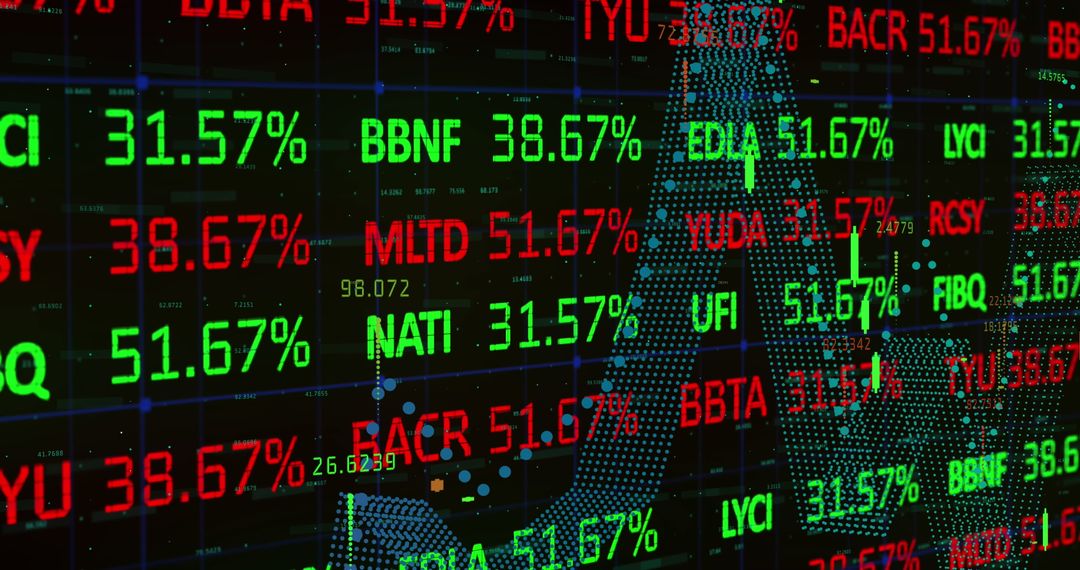
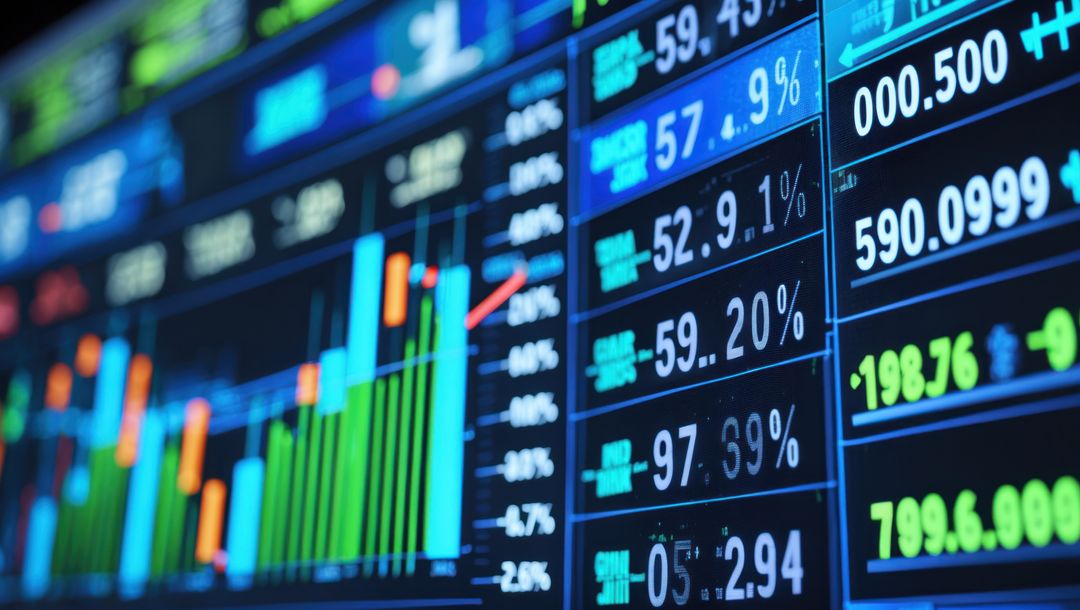
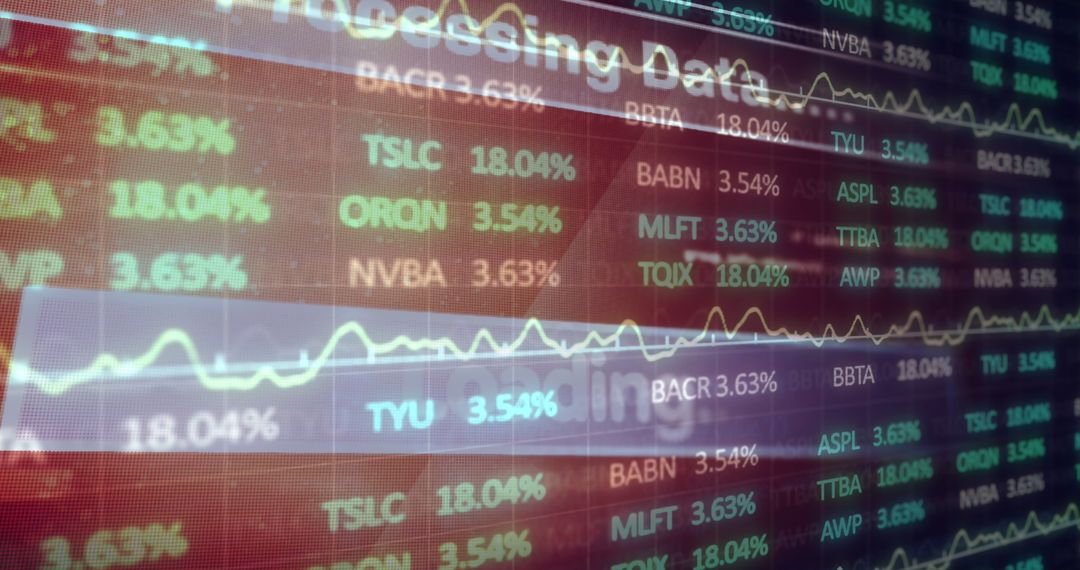
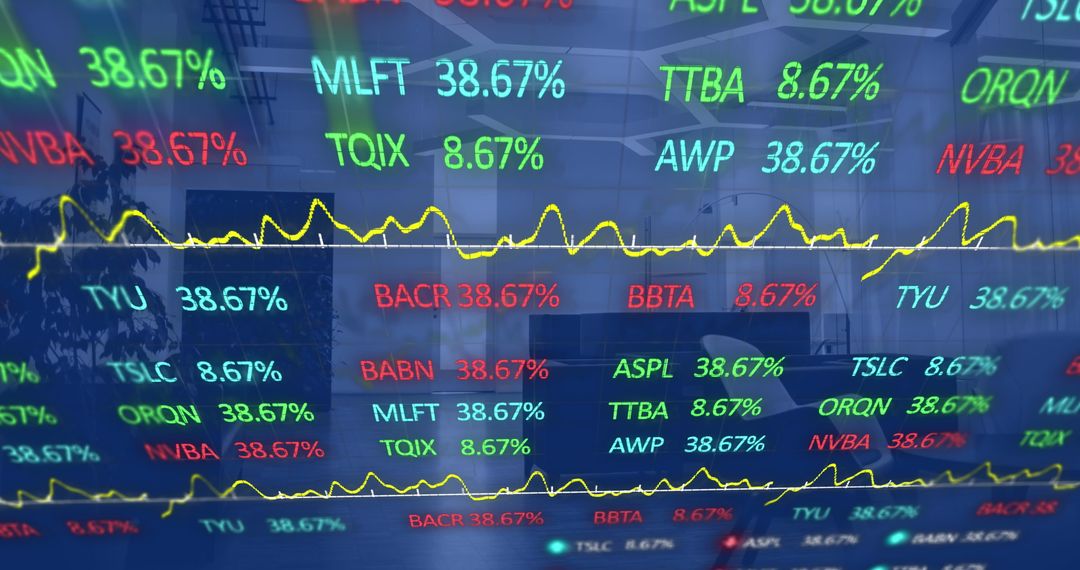
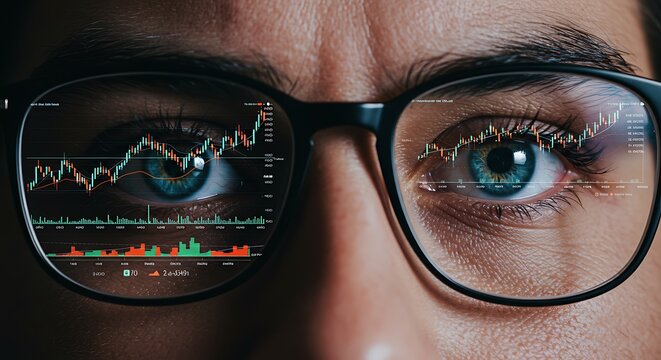
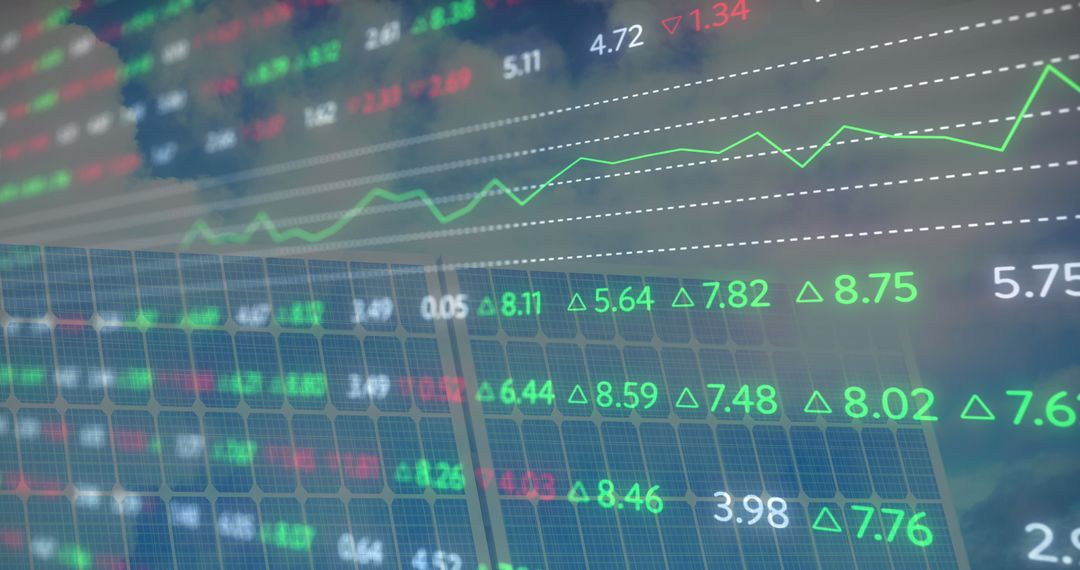
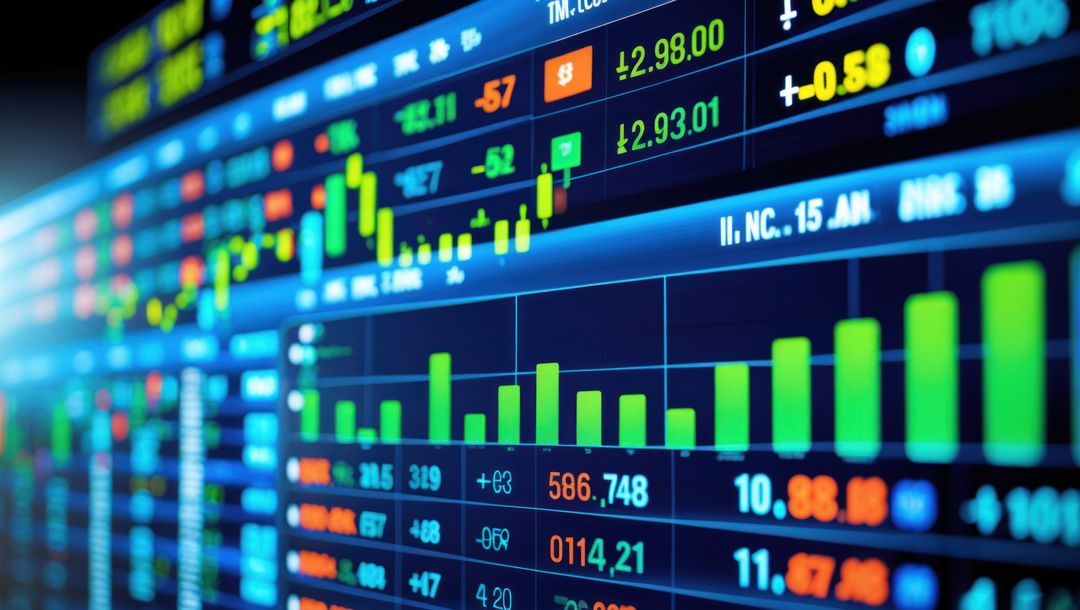
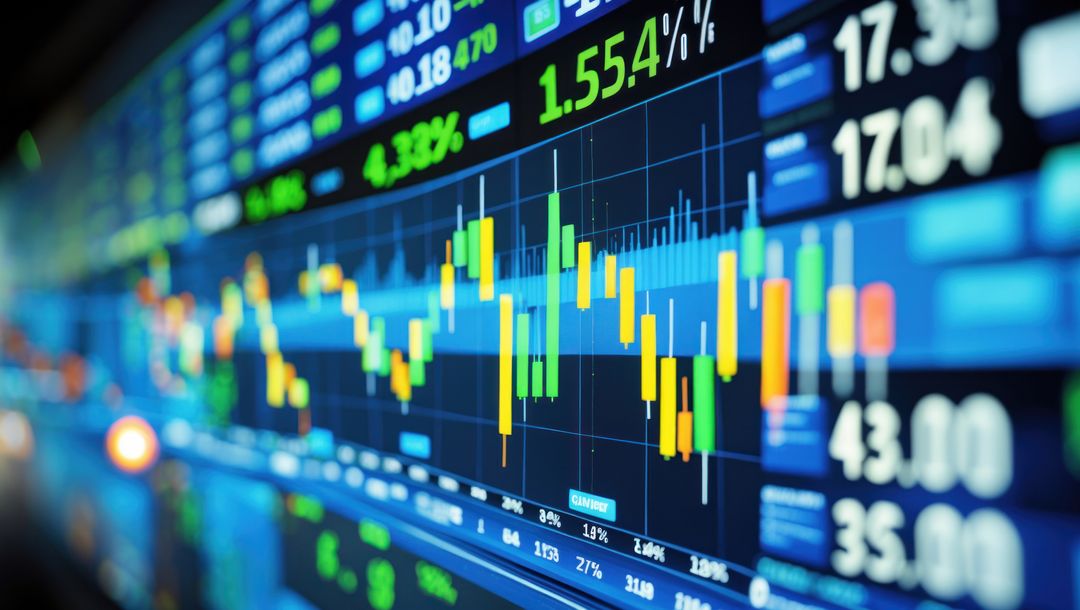
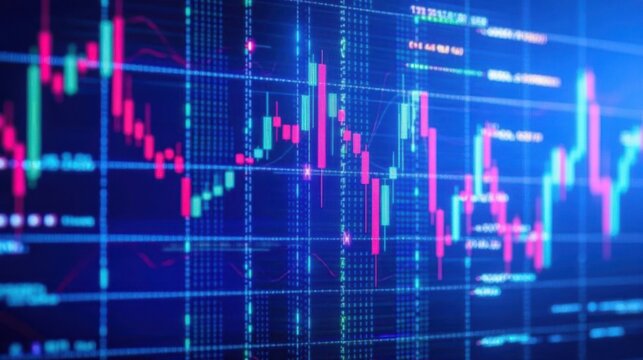
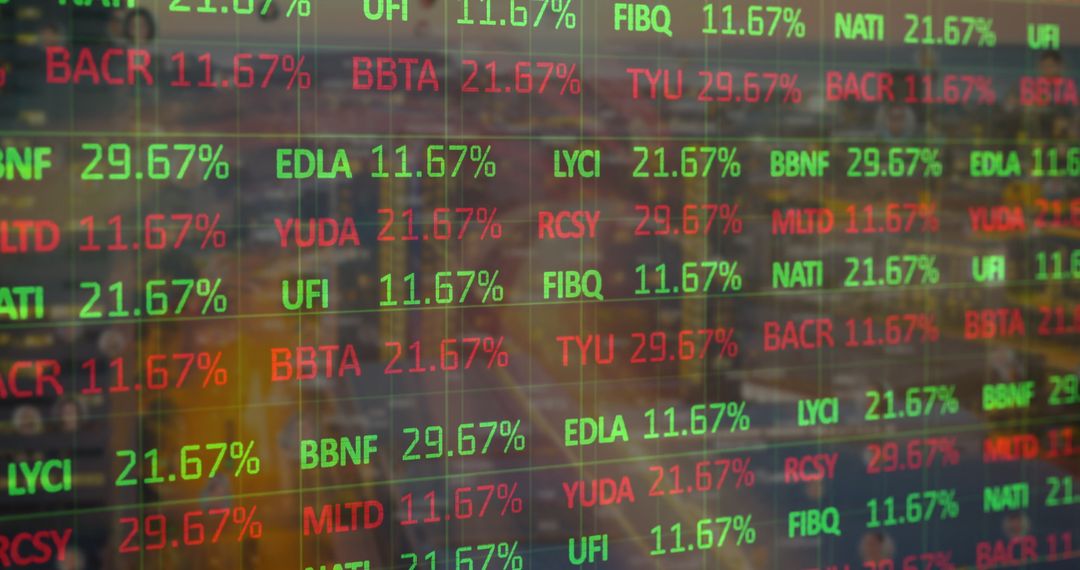
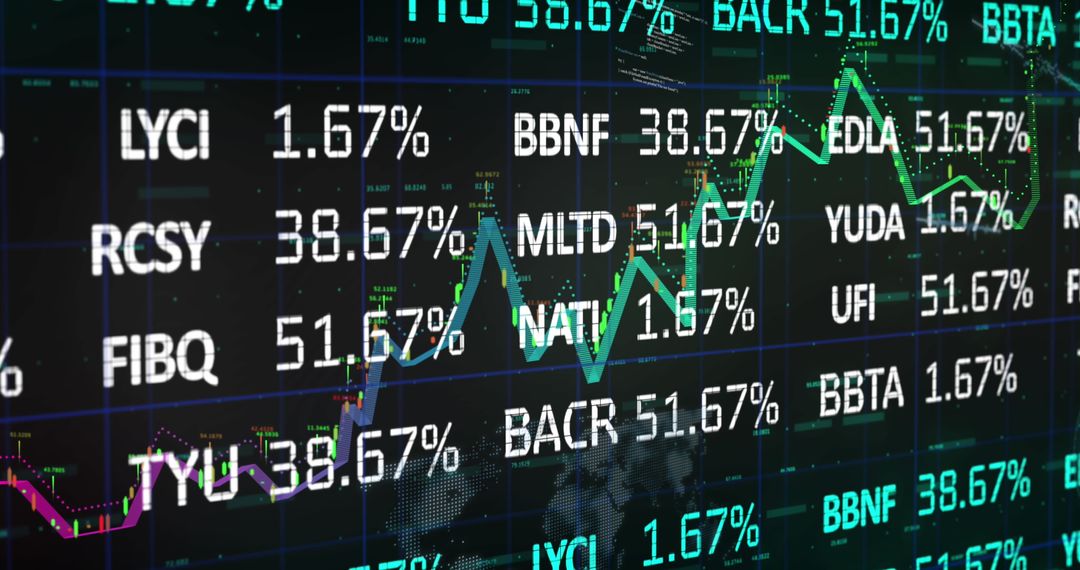
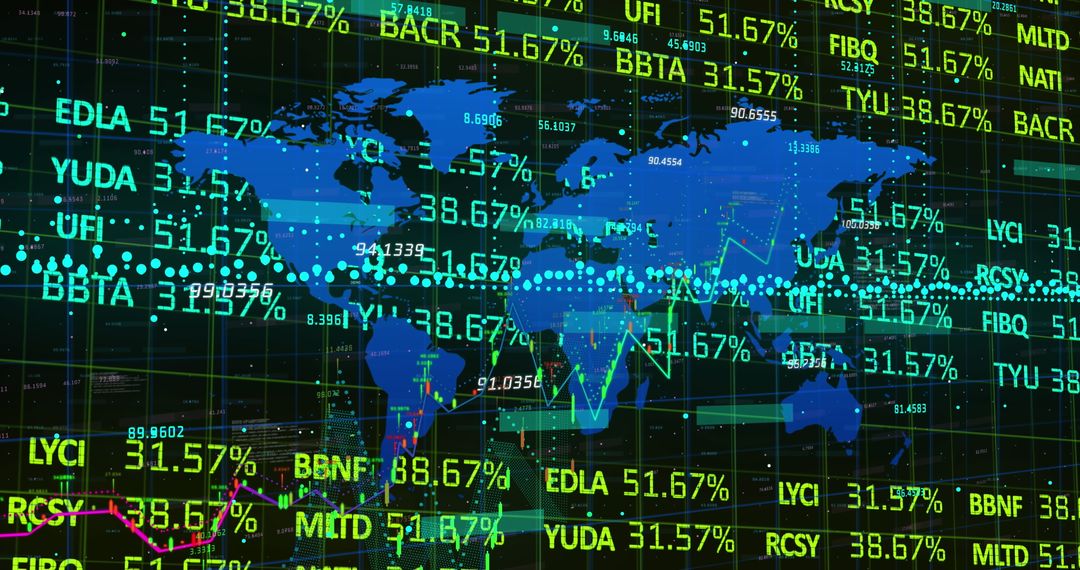
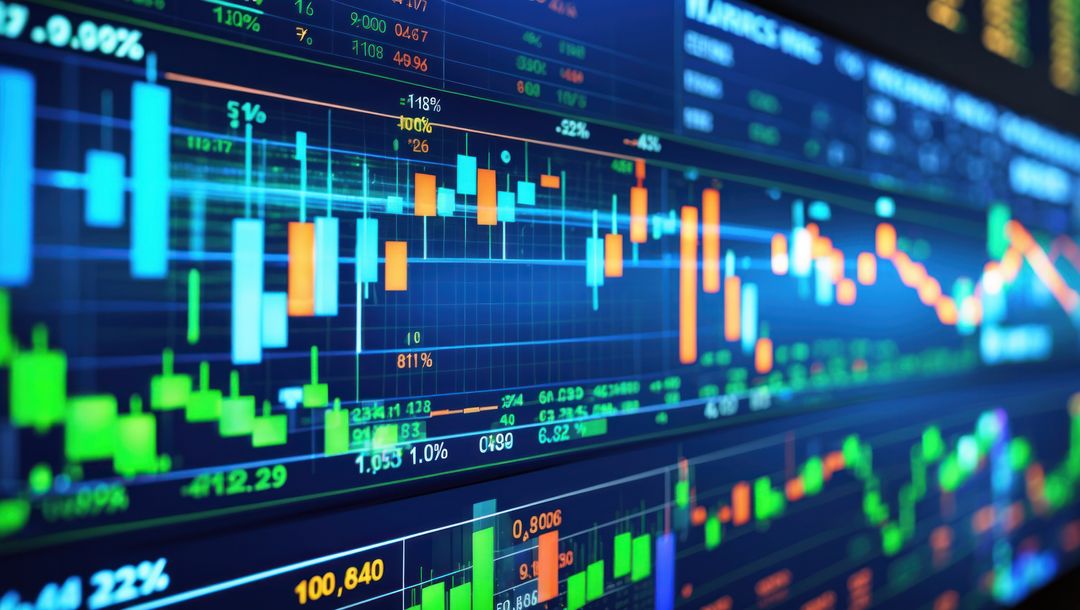
- Dynamic Candlestick Charts Displayed on Trading Screens in Financial Center
Dynamic Candlestick Charts Displayed on Trading Screens in Financial Center Image
AI Generated Image. Financial screens showing dynamic candlestick charts at a trading office. Vividly depicts the volatility of stock market with fluctuating graphics and percentages. Useful for illustrating concepts in technology, finance, investments, and analytics. Ideal for materials on stock market analysis, financial trading tools, economic trends, and data-driven decision making. Perfect for advertising trading platforms or depicting in articles about financial technology advancements.
Powered by 


2
downloads
downloads
Tags:
More
Credit Photo
If you would like to credit the Photo, here are some ways you can do so
Text Link
photo Link
<span class="text-link">
<span>
<a target="_blank" href=https://pikwizard.com/photo/dynamic-candlestick-charts-displayed-on-trading-screens-in-financial-center/58bf971ab5681527a7ec10acbc88d974/>PikWizard</a>
</span>
</span>
<span class="image-link">
<span
style="margin: 0 0 20px 0; display: inline-block; vertical-align: middle; width: 100%;"
>
<a
target="_blank"
href="https://pikwizard.com/photo/dynamic-candlestick-charts-displayed-on-trading-screens-in-financial-center/58bf971ab5681527a7ec10acbc88d974/"
style="text-decoration: none; font-size: 10px; margin: 0;"
>
<img src="https://pikwizard.com/pw/medium/58bf971ab5681527a7ec10acbc88d974.jpg" style="margin: 0; width: 100%;" alt="" />
<p style="font-size: 12px; margin: 0;">PikWizard</p>
</a>
</span>
</span>
Free (free of charge)
Free for personal and commercial use.
Author: AI Creator
Similar Free Stock Images

Premium


Premium


Premium


Premium

Premium


Premium


Premium


Premium


Premium


Premium

Premium

Premium


Premium


Premium


Premium


Premium


Premium

Premium


Premium


Premium

Premium


Premium

Premium

Premium