- Home >
- Stock Photos >
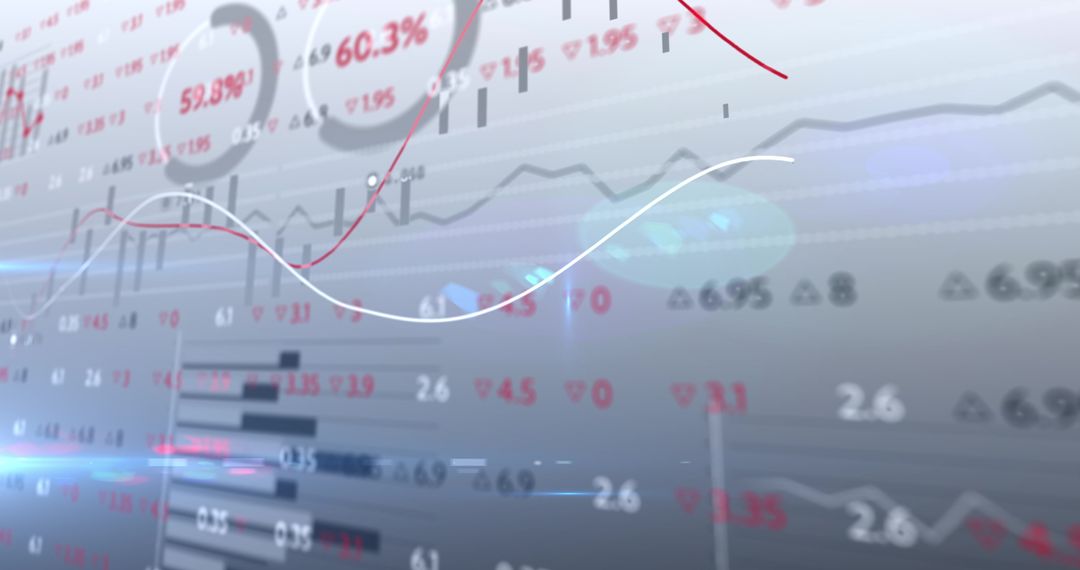
- Dynamic Countdown Over Stock Market Analysis
Dynamic Countdown Over Stock Market Analysis Image

Numbers and vibrant graphs overlay to represent stock market analysis within a financial context. Ideal for use in finance-related presentations, educational materials, and investment strategy reports highlighting market trends.
Powered by  - Get 15% off with code: PIKWIZARD15


2
downloads
downloads
Tags:
More
Credit Photo
If you would like to credit the Photo, here are some ways you can do so
Text Link
photo Link
<span class="text-link">
<span>
<a target="_blank" href=https://pikwizard.com/photo/dynamic-countdown-over-stock-market-analysis/4b2f5a72837ed291819655586d43e724/>PikWizard</a>
</span>
</span>
<span class="image-link">
<span
style="margin: 0 0 20px 0; display: inline-block; vertical-align: middle; width: 100%;"
>
<a
target="_blank"
href="https://pikwizard.com/photo/dynamic-countdown-over-stock-market-analysis/4b2f5a72837ed291819655586d43e724/"
style="text-decoration: none; font-size: 10px; margin: 0;"
>
<img src="https://pikwizard.com/pw/medium/4b2f5a72837ed291819655586d43e724.jpg" style="margin: 0; width: 100%;" alt="" />
<p style="font-size: 12px; margin: 0;">PikWizard</p>
</a>
</span>
</span>
Free (free of charge)
Free for personal and commercial use.
Author: Authentic Images
Similar Free Stock Images