- Home >
- Stock Photos >
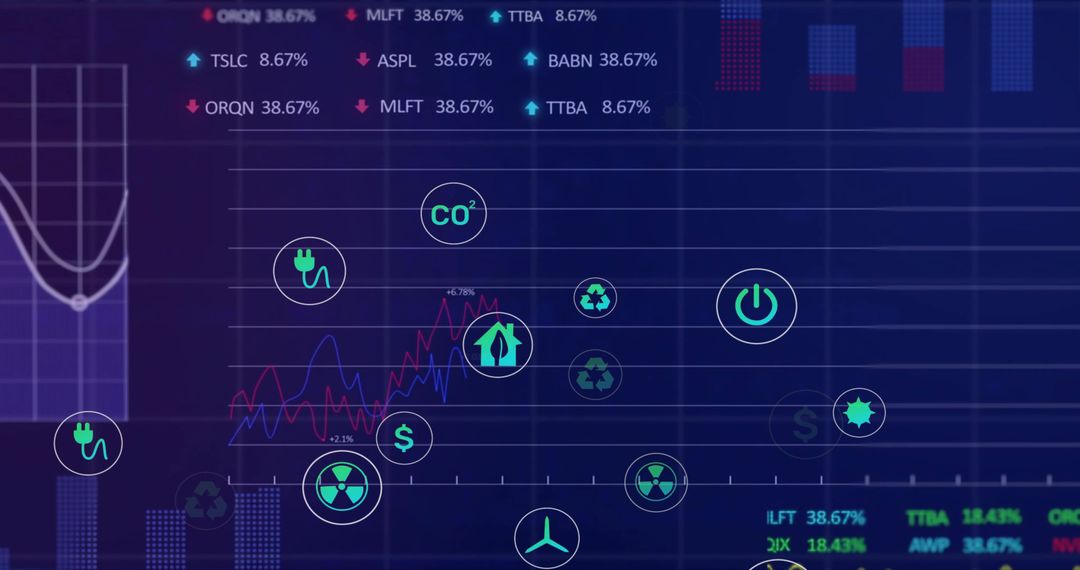
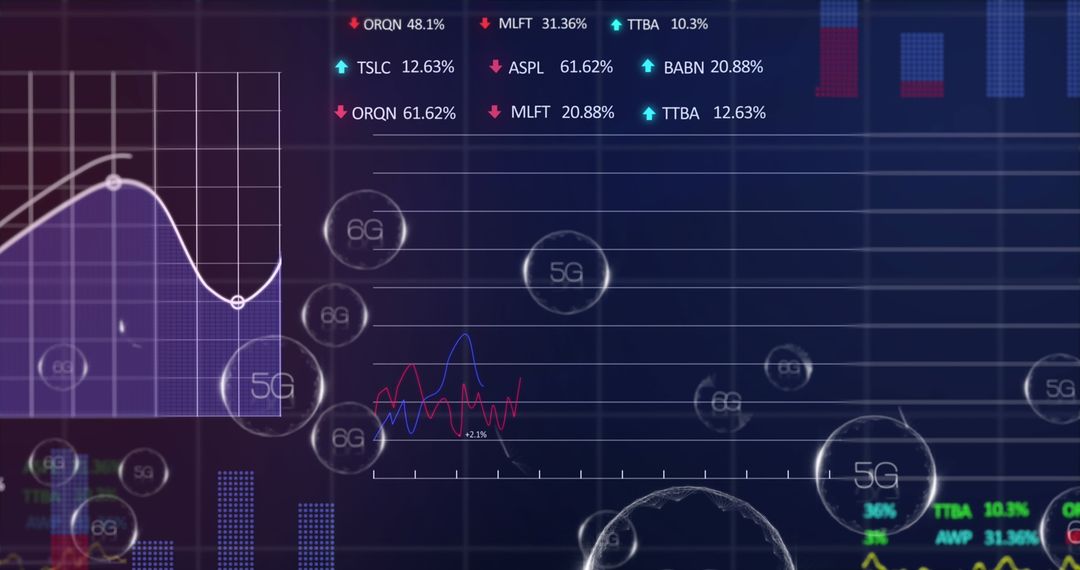
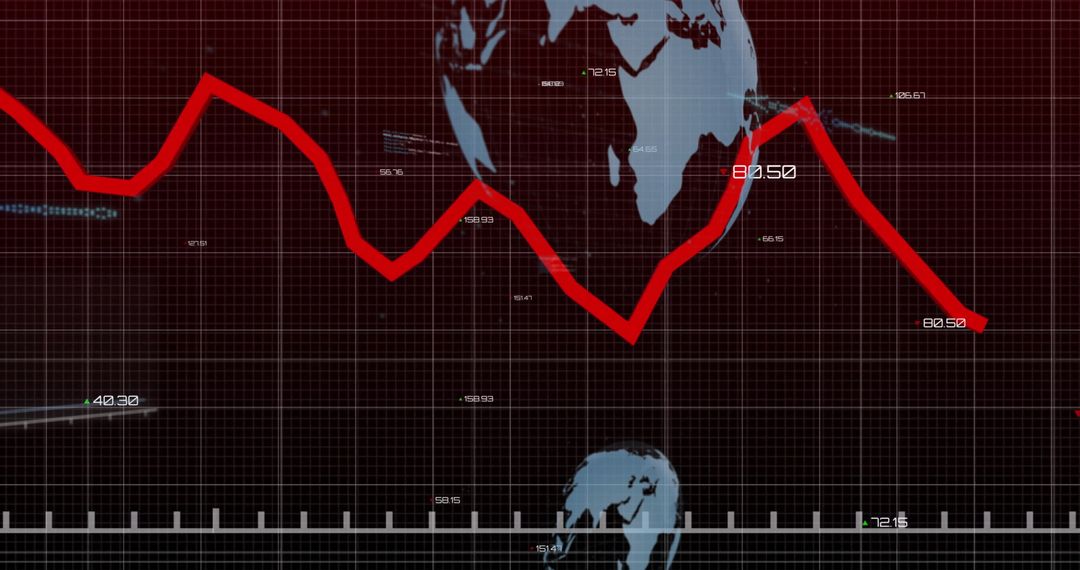
- Dynamic Cyan Data Trend Line with Green Eco Icons on Navy Background
Dynamic Cyan Data Trend Line with Green Eco Icons on Navy Background Image

This illustration presents a jagged cyan trend line against a navy background, adorned with green eco icons such as dollar signs, recycle symbols, wind turbines, radiations signs, and factories. It effectively conveys themes of data analysis and sustainable technology. Ideal for using in reports, presentations, or articles related to environmental analytics, financial data on renewable energy markets, or corporate documentation promoting sustainability frameworks.
Powered by  - Get 15% off with code: PIKWIZARD15


0
downloads
downloads
Tags:
More
Credit Photo
If you would like to credit the Photo, here are some ways you can do so
Text Link
photo Link
<span class="text-link">
<span>
<a target="_blank" href=https://pikwizard.com/photo/dynamic-cyan-data-trend-line-with-green-eco-icons-on-navy-background/058345c75e6605092e81b76d19b13685/>PikWizard</a>
</span>
</span>
<span class="image-link">
<span
style="margin: 0 0 20px 0; display: inline-block; vertical-align: middle; width: 100%;"
>
<a
target="_blank"
href="https://pikwizard.com/photo/dynamic-cyan-data-trend-line-with-green-eco-icons-on-navy-background/058345c75e6605092e81b76d19b13685/"
style="text-decoration: none; font-size: 10px; margin: 0;"
>
<img src="https://pikwizard.com/pw/medium/058345c75e6605092e81b76d19b13685.jpg" style="margin: 0; width: 100%;" alt="" />
<p style="font-size: 12px; margin: 0;">PikWizard</p>
</a>
</span>
</span>
Free (free of charge)
Free for personal and commercial use.
Author: People Creations
Similar Free Stock Images

Premium


Premium


Premium


Premium


Premium


Premium


Premium


Premium


Premium


Premium


Premium


Premium


Premium


Premium


Premium


Premium


Premium


Premium


Premium


Premium


Premium


Premium


Premium


Premium