- Home >
- Stock Photos >
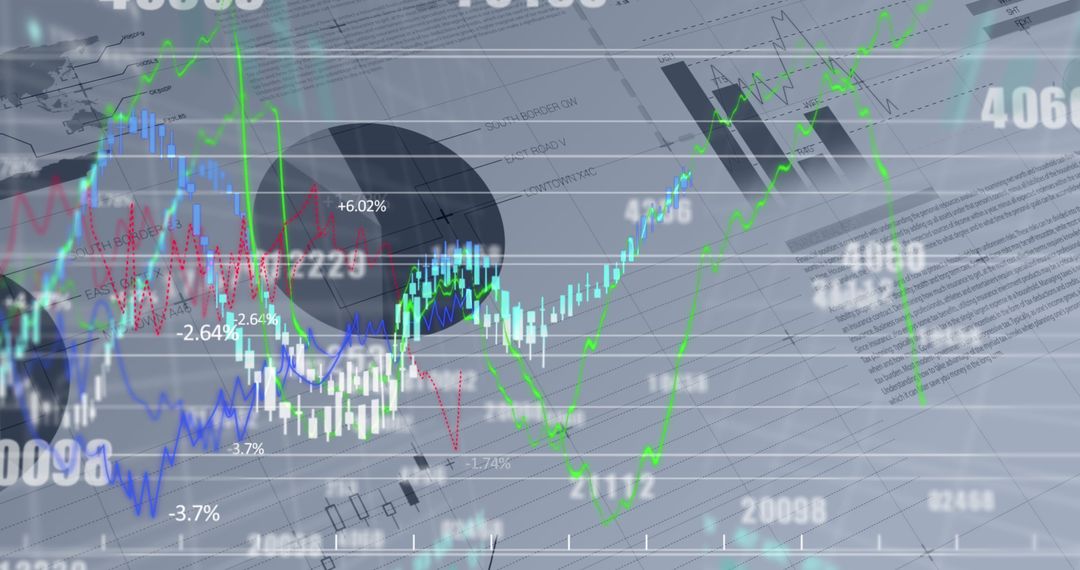
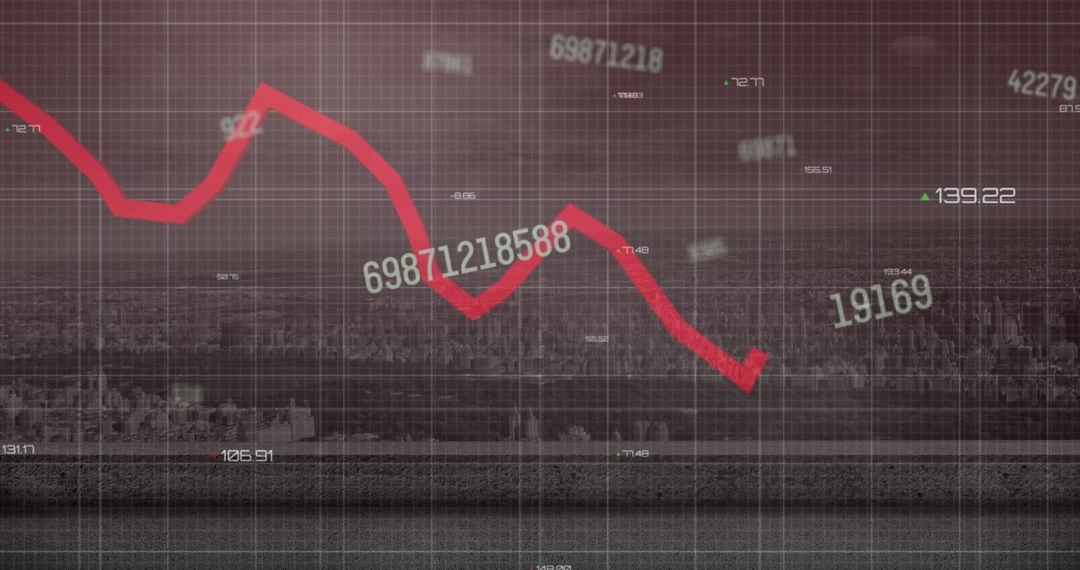
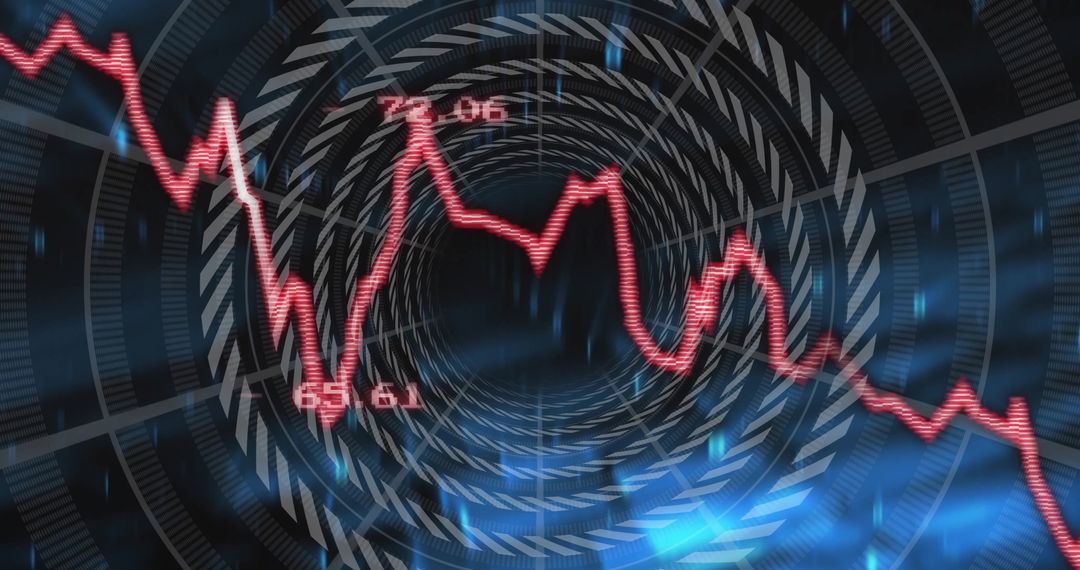
- Dynamic Data Visualization of Financial Market Trends
Dynamic Data Visualization of Financial Market Trends Image

Chart showing dynamic fluctuation trends in global financial markets. The design of gridlines and circular elements implies continuous data flow and interconnectedness, ideal for economic reports, corporate presentations, or animations in financial software depicting market insights.
Powered by 


2
downloads
downloads
Tags:
More
Credit Photo
If you would like to credit the Photo, here are some ways you can do so
Text Link
photo Link
<span class="text-link">
<span>
<a target="_blank" href=https://pikwizard.com/photo/dynamic-data-visualization-of-financial-market-trends/b01f270bb95431e3e17245349ce4a339/>PikWizard</a>
</span>
</span>
<span class="image-link">
<span
style="margin: 0 0 20px 0; display: inline-block; vertical-align: middle; width: 100%;"
>
<a
target="_blank"
href="https://pikwizard.com/photo/dynamic-data-visualization-of-financial-market-trends/b01f270bb95431e3e17245349ce4a339/"
style="text-decoration: none; font-size: 10px; margin: 0;"
>
<img src="https://pikwizard.com/pw/medium/b01f270bb95431e3e17245349ce4a339.jpg" style="margin: 0; width: 100%;" alt="" />
<p style="font-size: 12px; margin: 0;">PikWizard</p>
</a>
</span>
</span>
Free (free of charge)
Free for personal and commercial use.
Author: People Creations
Similar Free Stock Images

Premium


Premium


Premium


Premium


Premium


Premium


Premium


Premium


Premium


Premium


Premium


Premium


Premium


Premium


Premium


Premium


Premium


Premium


Premium


Premium


Premium


Premium


Premium


Premium