1. Home > 
  2. Stock Photos > 
  3. Dynamic Digital Finance Data Analysis with Green Graph Overlay

Dynamic Digital Finance Data Analysis with Green Graph Overlay Image

Dynamic Digital Finance Data Analysis with Green Graph Overlay

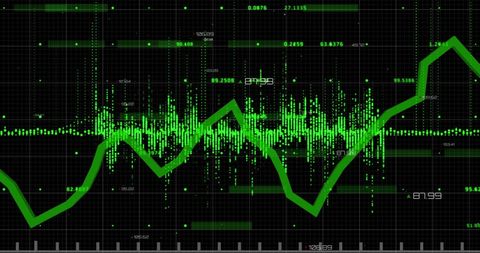
Depicts digital processing and analysis of financial data with green charts and graphs over a black background. Useful for illustrating concepts related to global finance, business analytics, stock market trends, financial technology, economic data analysis, statistical reporting, and corporate growth visualization.

Powered by Shutterstock logo - Get 15% off with code: PIKWIZARD15
Businessman works on laptop Showing business analytics dashboard with charts, metrics, and KPI to analyze performance and create insight reports for operations management. Data analysis concept.Ai - Powered by Shutterstock - Get 15% off with code: PIKWIZARD15Data science and big data technology. Scientist computing, analysing and visualizing complex data set on computer. Data mining, artificial intelligence, machine learning, business analytics. - Powered by Shutterstock - Get 15% off with code: PIKWIZARD15Big data technology and data science with person touching data flowing on virtual screen. Business analytics, artificial intelligence, machine learning. Engineer or scientist analyzing stream of data. - Powered by Shutterstock - Get 15% off with code: PIKWIZARD15Businesswomen use magnifier glass find stock in stock markets, uptrends, growth economics, business strategy development, and opportunities for investment, take profit from funds, Financial Analyst.  - Powered by Shutterstock - Get 15% off with code: PIKWIZARD15Businessman using laptop computer analyzing sales data and financial growth graph chart report. Business planning, strategy and development. Financial accounting. market research, data analysis - Powered by Shutterstock - Get 15% off with code: PIKWIZARD15

Credit Photo

If you would like to credit the Photo, here are some ways you can do so

Free (free of charge)

Free for personal and commercial use.

Author: Creative Art

Similar Free Stock Images

Digital Stock Market Data with Floating Points on Black Background
Premium
Finance, banking and investment, Asset allocation, budget management. Business woman calculating financial report, cost control and budgeting with business data graph growth chart. Tax and budgeting
Green Neon Network Waves on Dark Background
Digital Cardiograph on Black Background in Colorful Display
Pulsating Pink Heartbeat on Digital Grid Background
Glowing Cardiograph Line on Black Background Illustrates Vital Health Monitoring
Premium
Stock market or forex trading graph in futuristic concept suitable for financial investment or Economic trends business idea and all art work design. Abstract finance background
Digital Financial Graph on Green Background Showing Rising Trends
Dynamic Financial Graph in Virtual Red Grid Background
Digital Interface Showing Global Business Data Analytics
Fluctuating Digital Stock Market Data Chart
Premium
Businessman using computer for development and Analytics Data technology management System for report marketing strategy planning. graph analysis and information on a futuristic virtual screen.
Stagflation Concept with Digital Financial Graphs
Abstract Digital Wave Displaying Data Processing over Dark Background
Abstract Data Computing with Digital Light Trails
Abstract Digital Finance Chart Showing Fluctuating Graph Lines
Premium
Businessman analysis enterprise data management concept, Businessman analytics dashboard charts marketing, Financial organization strategy, Banking, Long-term business planning, Target, Goal setting
Rising Graph Line on Digital Green Grid Background
Digital Data Processing Interface with Green Growth Chart
Digital Data Prozessing with Global Interface Design
Digital Data Flow with Infographics Hologram
Premium
Business analysis, trading concept, Businessman, finance analyst using digital tablet, analyzing financial graph, stock market report, economic graph growth chart, business and technology background
Line Graph Illustrating Data Trend on Green Digital Background
Futuristic AI Concept with Digital Circuitry and Rising Arrows
Fluctuating Financial Graph on Green Grid Background
Digitized Medical Data Overlay with Cardio Graph and Medicine
Premium
Goals, objectives, plans. Human hands control, taking pieces of muclticolored diagram isolated on light background. Contemporary art collage. Inspiration, idea. Concept of work, occupation, business
Digital Graphs and Data Visualization on Green Background
Futuristic Digital Representation of DNA Strand
Neon Green ECG-Style Waveform on Digital Black Grid
Futuristic Data Visualization Graph Vector Rising Trend
Digital Green Economy Data Visualization with Floating Numbers
Line Graphs on Digital Background Show Financial Data Trends
Premium
Stock market analysis, business, finance and investment. Finance analyst analyzing stock market trading graph, economic growth chart, planning and strategy, business investment with financial report
Digital Cardiograph Display with Green Line over Black Background
Glowing Green Heartbeat Cardiograph on Black Grid
Glowing Cardiology Graph on Dark Background
Dynamic Financial Graph with Wavy Data Line over Navy Background
Premium
Analyst working in Business Analytics and Data Management System to make report with KPI and metrics connected to database. Corporate strategy for finance, operations, sales, marketing.
Digital Financial Data Analyzing Over Circular Grid Display
Digital Interface with Global Financial Graphs Background
Innovative Data Analysis with Dynamic Line Graph and Digital Elements
Abstract Financial Graph with Rising Waves on Red Gradient
Premium
Stock market graph trading analysis investment financial, stock exchange financial or forex graph stock market graph chart business crisis crash loss and grow up gain and profits win up trend.
Futuristic Financial Data Visualization on Digital Interface
Dynamic Green Light Trails Representing Digital Data Waves
Dynamic Financial Data Visualizations on Grid Interface
Abstract Digital Data with Upward Trending Line Graph
Premium
Businessman working with data management system on computer to make report with KPI and metrics connected to database. finance, operations, sales, marketing, KPI, business performance indicators.
Digital Simulated Global Financial Data and Graphs
Dynamic Green Line Graph Depicting Financial Data
Financial Data Graphics Over World Map in Digital Style
Green Digital Wave Abstract Background with Tech Elements
Premium
Economy and growth on global business network, Business strategy and Digital marketing. Data analysis of financial and banking, Technology protection and data connection
Financial Data Analysis with Futuristic Technology Interface
Futuristic Green Light Waves on Black Background
Digital Sound Wave with Frequency Bars on Dark Blue Background
Digital Data Stream With Futuristic Green Waveform
Premium
Female Chief Analyst Holds Meeting Presentation for a Team of Economists. She Shows Digital Interactive Whiteboard with Growth Analysis, Charts, Statistics and Data. People Work in Creative Office.
Futuristic Digital Graph Showing Data Trends on Analytic Interface
Futuristic Green Line Graph on Digital Grid Background
Advanced Digital Dashboard with Rising Bar and Line Charts
Dynamic Digital Data Visualization with Dot Graph Design
Graph Lines Portraying Financial Data Trends
Digital Abstract Green Neon Waveforms on Black Background
Premium
Analyst Works on Personal Computer Showing business analytics dashboard with charts, metrics and KPI to analyze performance and create insight reports for operations management. Data analysis concept.
Neon Green Electrocardiogram Wave on Black Background
Vibrant Green ECG Display on Black Background Media
Digital Financial Graph Over Violet Background in Abstract Style
Dynamic Financial Graph on Luminous Green Background
Premium
Two diverse crypto traders brokers stock exchange market investors discussing trading charts research reports growth using pc computer looking at screen analyzing invest strategy, financial risks.
Data Analytics and Financial Growth Indicators
Digital Data Analysis with Green Line Graph on Grid Background
Financial Graph Analysis on Green Grid Background
Digital Network Connections and Data Processing Illustrative Graphic
Premium
Man look at the dashboard with graphs and charts. Concept of data management system, business intelligence, data statistics, marketing analysis, key performance indicators (KPI) and analytics.
Dynamic Green Line Graph Showing Financial Data Fluctuations
Neon Pink Cardiograph on Black Background
Dynamic Financial Data Waves in Digital Cyber World
Data Visualization with Rising Red Arrow and Floating Numbers
Premium
Data analytics and insights powered by big data and artificial intelligence technologies. Data scientist working with complex information analysed by AI for business analytics dashboard with charts.
Dynamic Green Stock Market Chart with Upward Arrows
NFT Financial Data Visualization with Digital Graph Overlay
Financial Data Processing with Green Digital Graph in Action
Green Line Graph with Data Points on Grid Background
Premium
Analyst working with Business Analytics and Data Management System on computer to make report with KPI and metrics connected to database. Corporate strategy for finance, operations, sales, marketing
Digital Data Wave with Cyber Security Elements
Abstract Representation of Financial Data Processing
Green Line Graph on Dark Digital Grid
Dynamic Data Analysis on Digital Graph, Technology Background
Premium
Business meeting with hands on documents, charts, and graphs. Focus on data analysis, strategy, and teamwork. Professional setting data analysis meeting with digital overlay.
Futuristic Digital Waveform with White and Green Design
Digital Data Waveform and Red Arrows on Screen
Dynamic Green Graph with Digital Data on Dark Background
Abstract Green Neon Wave Technology Background
Glowing Blue Cardiograph on Black Background Interface
Neon Electrocardiogram Wave On Black Background
Premium
Big data analytics with AI technology. Data analyst analyzing and visualizing complex information network with artificial intelligence. Machine learning algorithm for business analytics and finance.
Rising Financial Graph on Dark Grid Background
Financial Growth Graph on Green Digital Grid Background
Dynamic Financial Chart with Data Points on Red Grid Background
Digital Financial Data Display with Graph and Grid
Premium
business documents on office table with smart phone and laptop computer and graph financial with social network diagram and three colleagues discussing data in the background
Futuristic Graph and Data Visualization Interface Design
Dynamic Stagflation Concept Displaying Economic Burdens
Digital Data Network with Dynamic Connections
Futuristic Digital Interface with Light Trails and Technology
Premium
Conference Business Meeting Presentation: CEO Businessman Shows Data to Group of Investors, Businessspeople. Projector Screen Shows Graphs, Product Sales, Revenue Growth Strategy, e-Commerce Analysis
Digital Finance Chart Overlaying Globe Background
Colorful Data Visualization on Dark Background
Green Data Graph on Black Digital Interface
Digital Financial Data Analytics and Trend Graphs
Premium
Businessman using tablet Analytics Data KPI Dashboard Tech with charts, metrics, and KPI to analyze performance and create insight reports for operations management.Data mining.Data analysis.Ai
Digital Graph Displaying Dynamic Data Analysis
Cityscape with Digital Stock Market Graphs and Statistics
Digital Data Visualization with Green Graph and Scanning Beams
Global Data Analytics Over World Map with Numeric Statistics
Premium
Conference Business Meeting Presentation: CEO Businessman Shows Data to Group of Investors, Businessspeople. Projector Screen Shows Graphs, Product Sales, Revenue Growth Strategy, e-Commerce Analysis
Digital Data Processing with Graph and Grid Technology Interface
Financial Growth Stock Nikkei in Urban City Skyline
Abstract Green Waves in Digital Motion Fantasy Scape
Digital Data Processing with Chart in Futuristic Interface
Premium
Financial advisor explaining invest stock market data consulting investor. Two busy business men analysts doing finance trading analysis pointing at exchange chart on laptop screen working in office.
Dynamic Line Chart Representing Financial Data Growth