
- Home >
- Stock Photos >
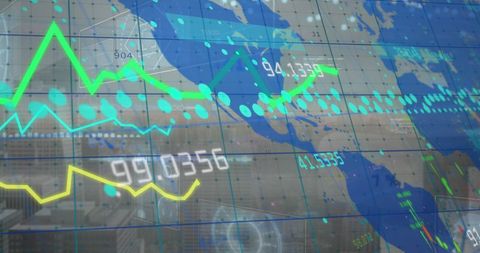
- Dynamic Digital Financial Chart with Market Trends and Data Analysis
Dynamic Digital Financial Chart with Market Trends and Data Analysis Image

This visualization captures the fluctuating patterns of a financial market chart with candlestick bars and colorful line plots. It provides insights into stock movements, ideal for investors, analysts, and financial educators. Perfect for financial reports, educational materials, or presentations on market trends and data technology.
Powered by  - Get 15% off with code: PIKWIZARD15


0
downloads
downloads
Tags:
More
Credit Photo
If you would like to credit the Photo, here are some ways you can do so
Text Link
photo Link
<span class="text-link">
<span>
<a target="_blank" href=https://pikwizard.com/photo/dynamic-digital-financial-chart-with-market-trends-and-data-analysis/1ec08d6a6dae0c48c95d955667ea31bd/>PikWizard</a>
</span>
</span>
<span class="image-link">
<span
style="margin: 0 0 20px 0; display: inline-block; vertical-align: middle; width: 100%;"
>
<a
target="_blank"
href="https://pikwizard.com/photo/dynamic-digital-financial-chart-with-market-trends-and-data-analysis/1ec08d6a6dae0c48c95d955667ea31bd/"
style="text-decoration: none; font-size: 10px; margin: 0;"
>
<img src="https://pikwizard.com/pw/medium/1ec08d6a6dae0c48c95d955667ea31bd.jpg" style="margin: 0; width: 100%;" alt="" />
<p style="font-size: 12px; margin: 0;">PikWizard</p>
</a>
</span>
</span>
Free (free of charge)
Free for personal and commercial use.
Author: People Creations
Similar Free Stock Images

Premium


Premium


Premium


Premium


Premium


Premium


Premium


Premium


Premium


Premium


Premium


Premium


Premium


Premium


Premium


Premium


Premium


Premium


Premium


Premium


Premium


Premium


Premium


Premium


Premium

