- Home >
- Stock Photos >
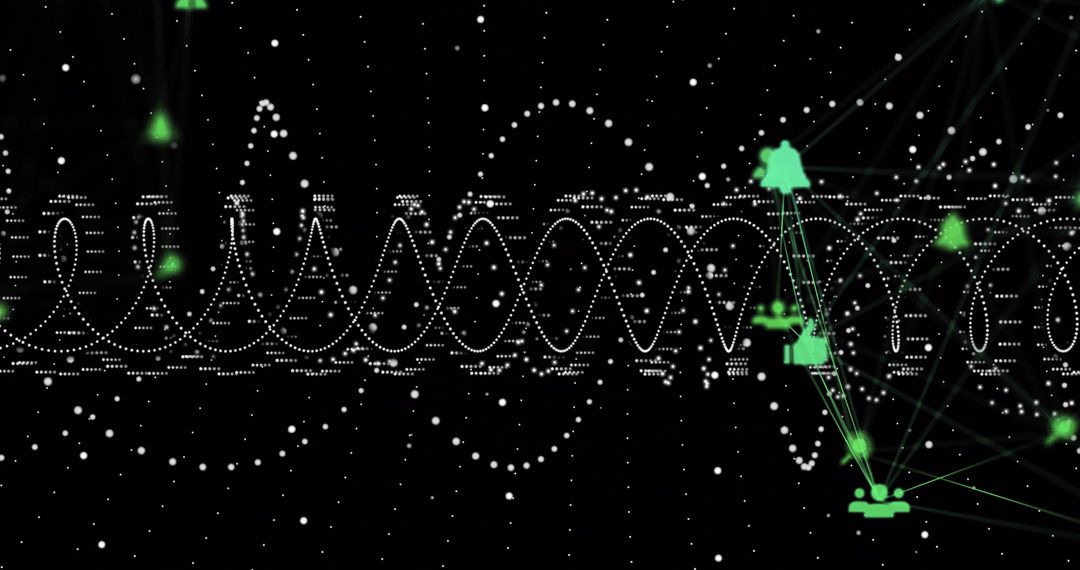
- Dynamic Digital Projection of Market Trends and Equations
Dynamic Digital Projection of Market Trends and Equations Image

Displays a complex visualization of graphs and mathematical equations on multiple screens. An ideal element for presentations involving market trend analysis, financial projects, data science, projections, academic research, or technology showcases. Enhances content focused on statistical research and informative scientific studies.
Powered by  - Get 15% off with code: PIKWIZARD15


4
downloads
downloads
Tags:
More
Credit Photo
If you would like to credit the Photo, here are some ways you can do so
Text Link
photo Link
<span class="text-link">
<span>
<a target="_blank" href=https://pikwizard.com/photo/dynamic-digital-projection-of-market-trends-and-equations/21baafda73835389ac4cd0f842cde807/>PikWizard</a>
</span>
</span>
<span class="image-link">
<span
style="margin: 0 0 20px 0; display: inline-block; vertical-align: middle; width: 100%;"
>
<a
target="_blank"
href="https://pikwizard.com/photo/dynamic-digital-projection-of-market-trends-and-equations/21baafda73835389ac4cd0f842cde807/"
style="text-decoration: none; font-size: 10px; margin: 0;"
>
<img src="https://pikwizard.com/pw/medium/21baafda73835389ac4cd0f842cde807.jpg" style="margin: 0; width: 100%;" alt="" />
<p style="font-size: 12px; margin: 0;">PikWizard</p>
</a>
</span>
</span>
Free (free of charge)
Free for personal and commercial use.
Author: Creative Art
Similar Free Stock Images

Premium


Premium


Premium


Premium


Premium


Premium


Premium


Premium


Premium


Premium


Premium


Premium


Premium


Premium


Premium


Premium


Premium


Premium


Premium


Premium


Premium


Premium


Premium


Premium