- Home >
- Stock Photos >
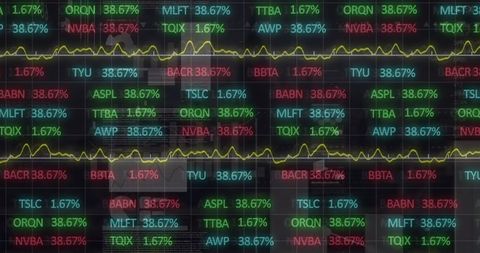
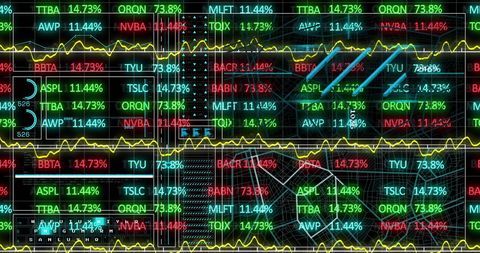
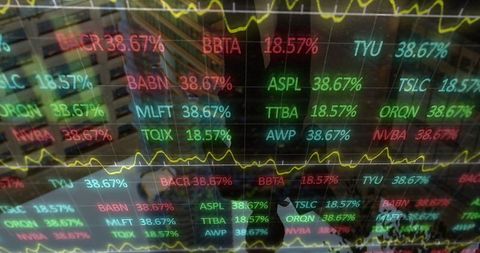
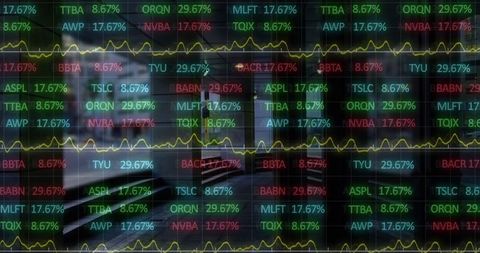
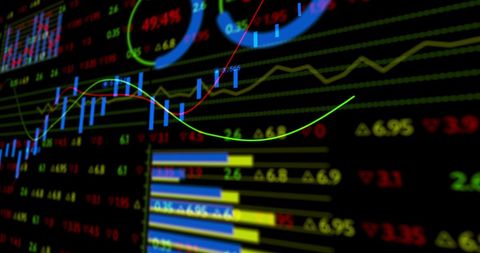
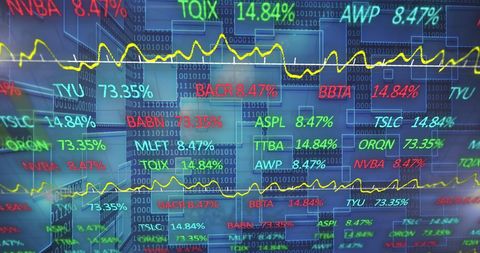
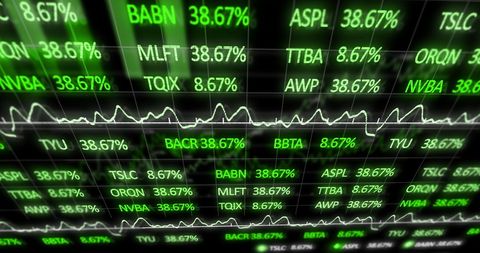
- Dynamic Display of Digital Financial Data and Graphs
Dynamic Display of Digital Financial Data and Graphs Image

This visually captivating representation of financial data processing highlights various graphs, numbers, and indicators over a dark background. Suitable for use in articles and presentations related to technology, finance, global economy, stock market analysis, financial institutions, and data analytics. This image alludes to the complexities and dynamic nature of modern financial data interaction.
Powered by  - Get 15% off with code: PIKWIZARD15


2
downloads
downloads
Tags:
More
Credit Photo
If you would like to credit the Photo, here are some ways you can do so
Text Link
photo Link
<span class="text-link">
<span>
<a target="_blank" href=https://pikwizard.com/photo/dynamic-display-of-digital-financial-data-and-graphs/f4437a0618005b43c23b591c8760059a/>PikWizard</a>
</span>
</span>
<span class="image-link">
<span
style="margin: 0 0 20px 0; display: inline-block; vertical-align: middle; width: 100%;"
>
<a
target="_blank"
href="https://pikwizard.com/photo/dynamic-display-of-digital-financial-data-and-graphs/f4437a0618005b43c23b591c8760059a/"
style="text-decoration: none; font-size: 10px; margin: 0;"
>
<img src="https://pikwizard.com/pw/medium/f4437a0618005b43c23b591c8760059a.jpg" style="margin: 0; width: 100%;" alt="" />
<p style="font-size: 12px; margin: 0;">PikWizard</p>
</a>
</span>
</span>
Free (free of charge)
Free for personal and commercial use.
Author: People Creations
Similar Free Stock Images
Premium


Premium


Premium


Premium


Premium


Premium


Premium


Premium


Premium


Premium


Premium


Premium


Premium


Premium


Premium


Premium


Premium


Premium


Premium


Premium


Premium


Premium


Premium


Premium


Premium