
- Home >
- Stock Photos >
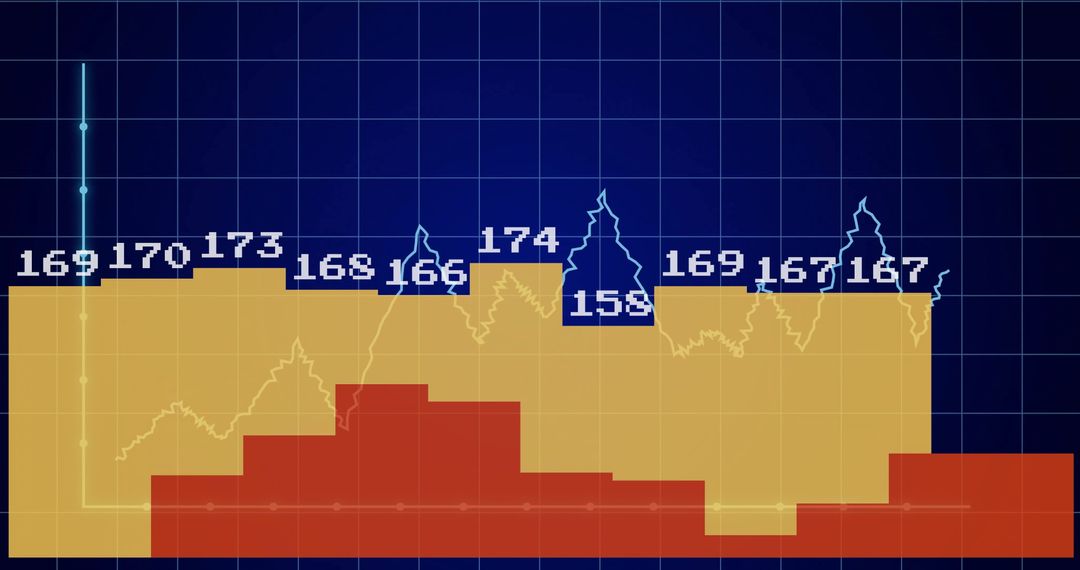
- Dynamic Display of Financial Graphs and Stock Market Data
Dynamic Display of Financial Graphs and Stock Market Data Image

This dynamic presentation features financial graphs and stock market data processing on a digital interface set against a dark background. Elements like charts visualizing stock performance and economic progress emphasize themes of global finance and investment analytics. Useful for illustrating topics related to economics, business, financial education, and technology advancements.
Powered by  - Get 15% off with code: PIKWIZARD15


2
downloads
downloads
Tags:
More
Credit Photo
If you would like to credit the Photo, here are some ways you can do so
Text Link
photo Link
<span class="text-link">
<span>
<a target="_blank" href=https://pikwizard.com/photo/dynamic-display-of-financial-graphs-and-stock-market-data/0094b040f77d6ffd87e845179a94895d/>PikWizard</a>
</span>
</span>
<span class="image-link">
<span
style="margin: 0 0 20px 0; display: inline-block; vertical-align: middle; width: 100%;"
>
<a
target="_blank"
href="https://pikwizard.com/photo/dynamic-display-of-financial-graphs-and-stock-market-data/0094b040f77d6ffd87e845179a94895d/"
style="text-decoration: none; font-size: 10px; margin: 0;"
>
<img src="https://pikwizard.com/pw/medium/0094b040f77d6ffd87e845179a94895d.jpg" style="margin: 0; width: 100%;" alt="" />
<p style="font-size: 12px; margin: 0;">PikWizard</p>
</a>
</span>
</span>
Free (free of charge)
Free for personal and commercial use.
Author: Awesome Content
Similar Free Stock Images

Premium


Premium


Premium


Premium


Premium


Premium


Premium


Premium


Premium


Premium


Premium


Premium


Premium


Premium


Premium


Premium


Premium


Premium


Premium


Premium


Premium


Premium


Premium


Premium

