- Home >
- Stock Photos >
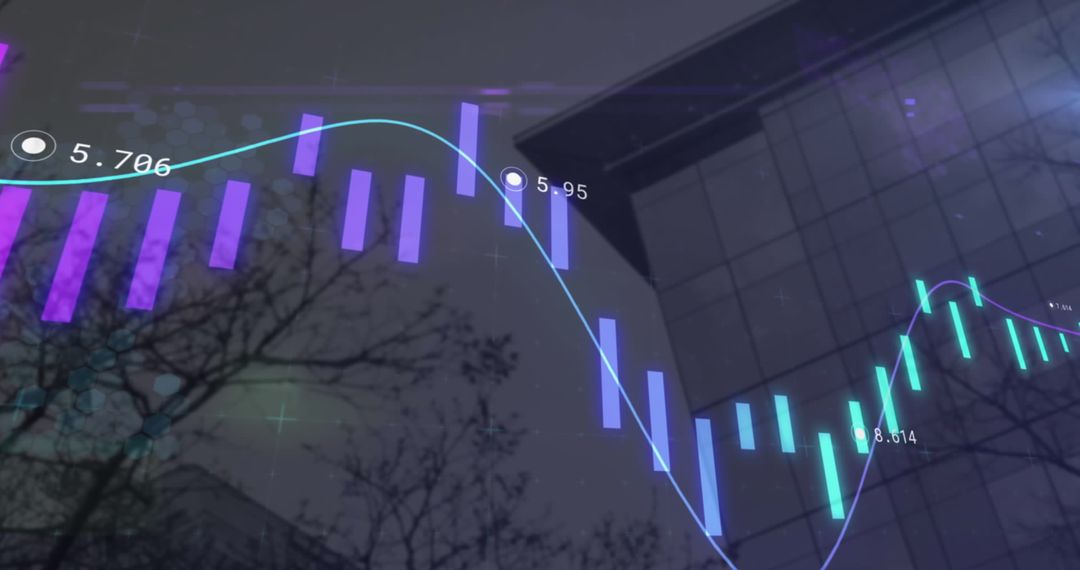
- Dynamic Financial Chart with Blue and Purple Indicators
Dynamic Financial Chart with Blue and Purple Indicators Image

Visualization represents digital financial metrics and data processing using blue and purple charts and graphs. Suitable for use in business presentations, financial analysis reports, technology-related graphics, and educational contexts focusing on data-driven decisions.
Powered by 


2
downloads
downloads
Tags:
More
Credit Photo
If you would like to credit the Photo, here are some ways you can do so
Text Link
photo Link
<span class="text-link">
<span>
<a target="_blank" href=https://pikwizard.com/photo/dynamic-financial-chart-with-blue-and-purple-indicators/9d0a3015b71b30c82a108970e6bd3732/>PikWizard</a>
</span>
</span>
<span class="image-link">
<span
style="margin: 0 0 20px 0; display: inline-block; vertical-align: middle; width: 100%;"
>
<a
target="_blank"
href="https://pikwizard.com/photo/dynamic-financial-chart-with-blue-and-purple-indicators/9d0a3015b71b30c82a108970e6bd3732/"
style="text-decoration: none; font-size: 10px; margin: 0;"
>
<img src="https://pikwizard.com/pw/medium/9d0a3015b71b30c82a108970e6bd3732.jpg" style="margin: 0; width: 100%;" alt="" />
<p style="font-size: 12px; margin: 0;">PikWizard</p>
</a>
</span>
</span>
Free (free of charge)
Free for personal and commercial use.
Author: People Creations
Similar Free Stock Images

Premium


Premium


Premium


Premium


Premium


Premium


Premium


Premium


Premium


Premium


Premium


Premium


Premium


Premium


Premium


Premium


Premium


Premium


Premium


Premium


Premium


Premium


Premium


Premium