- Home >
- Stock Photos >
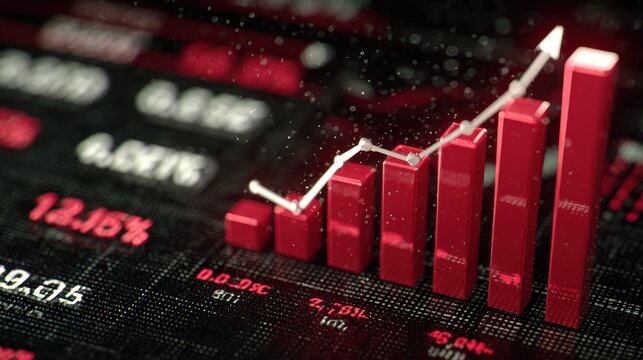
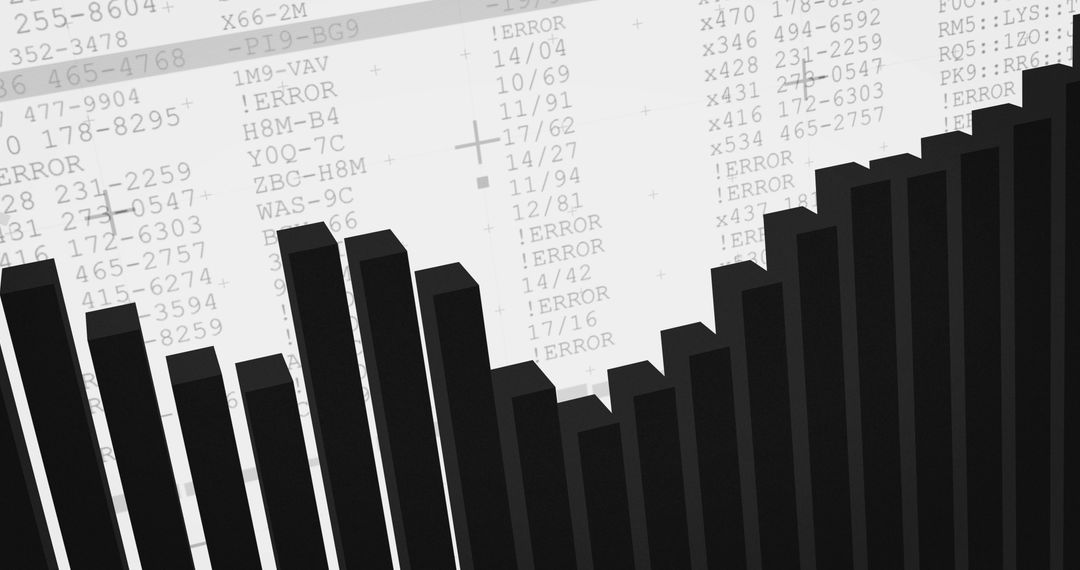
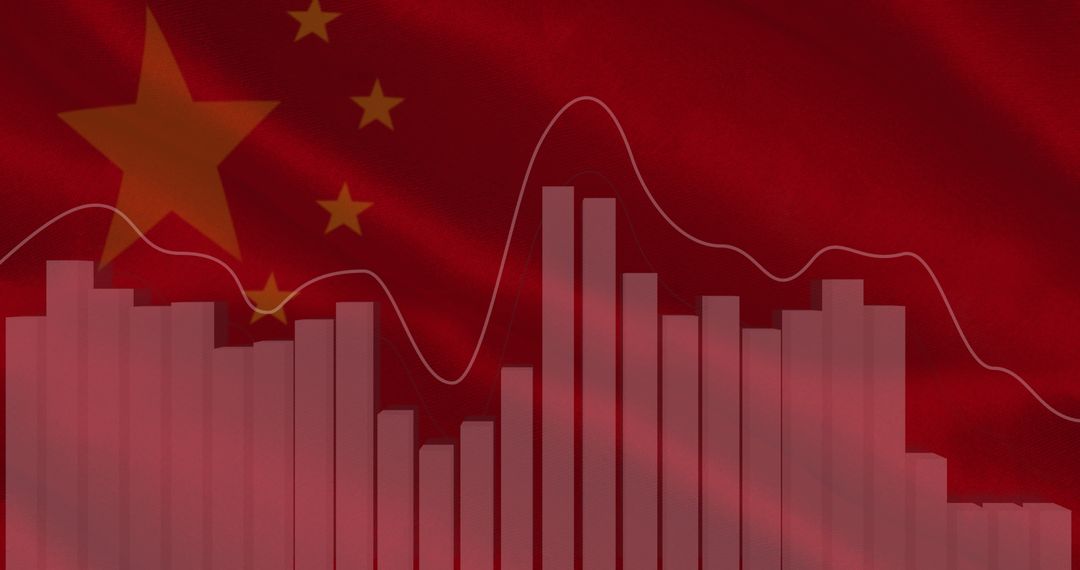
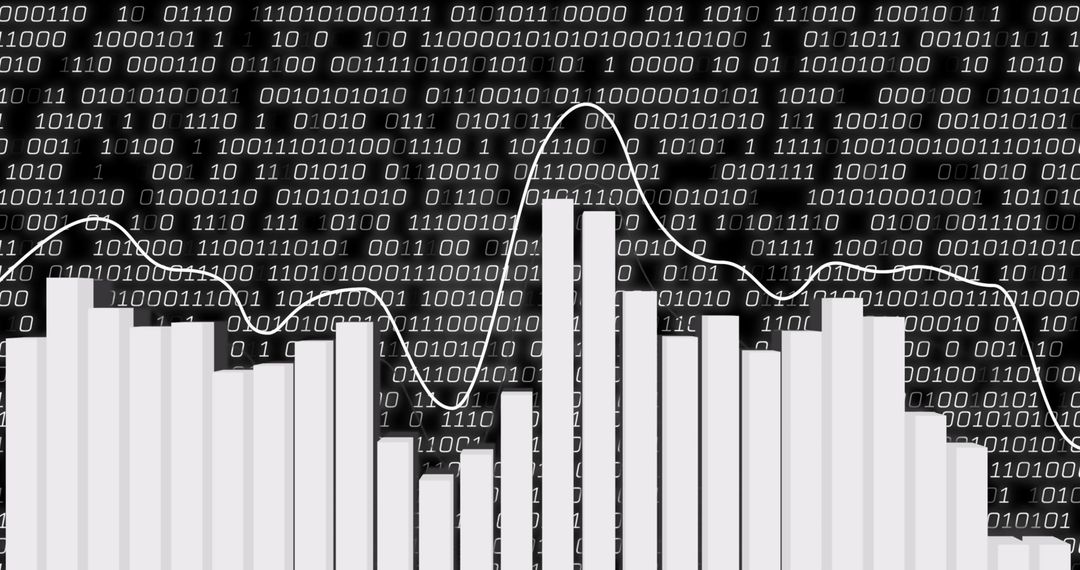
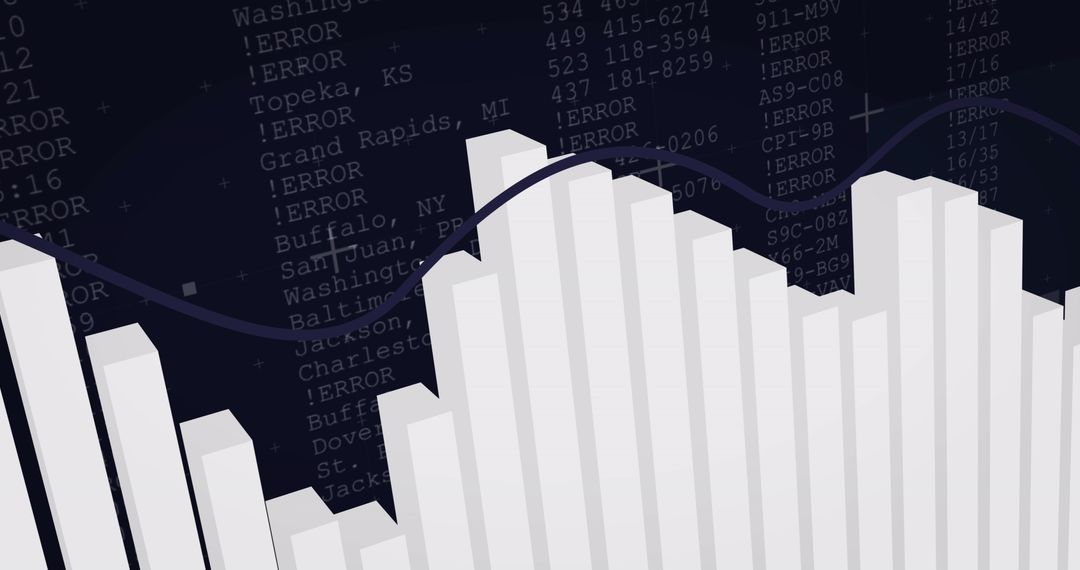
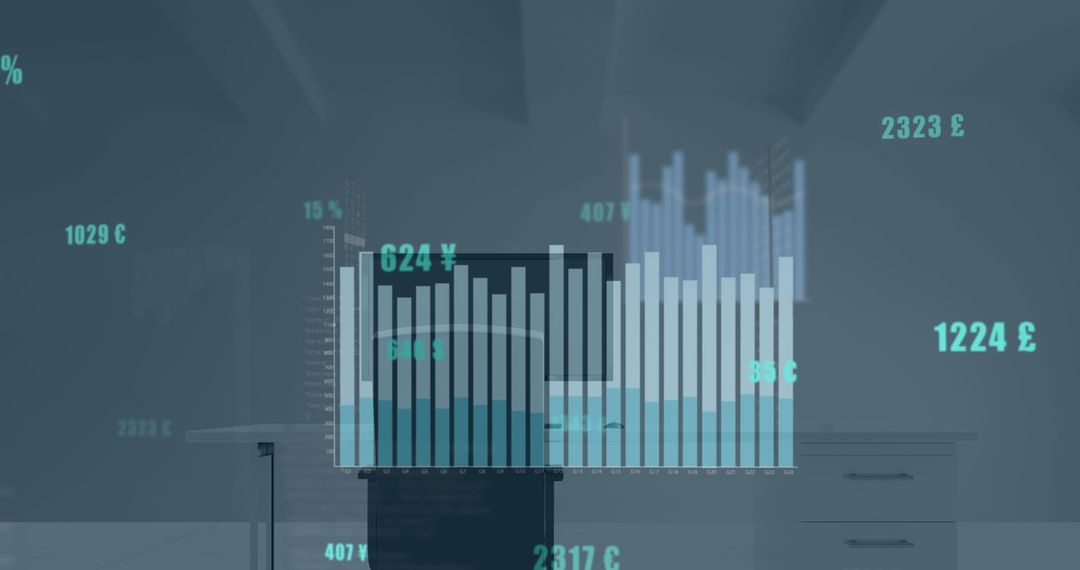
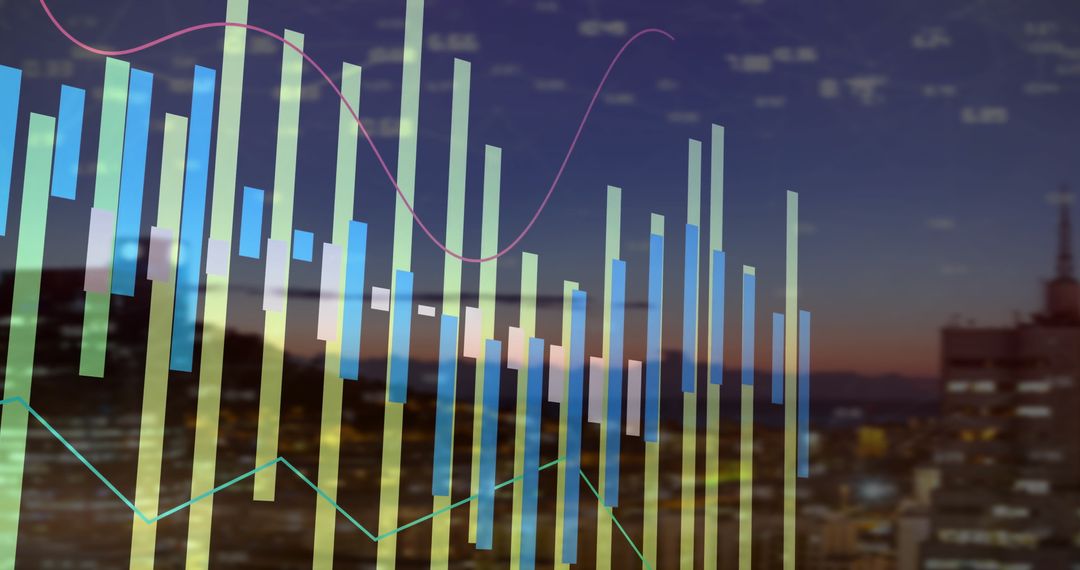
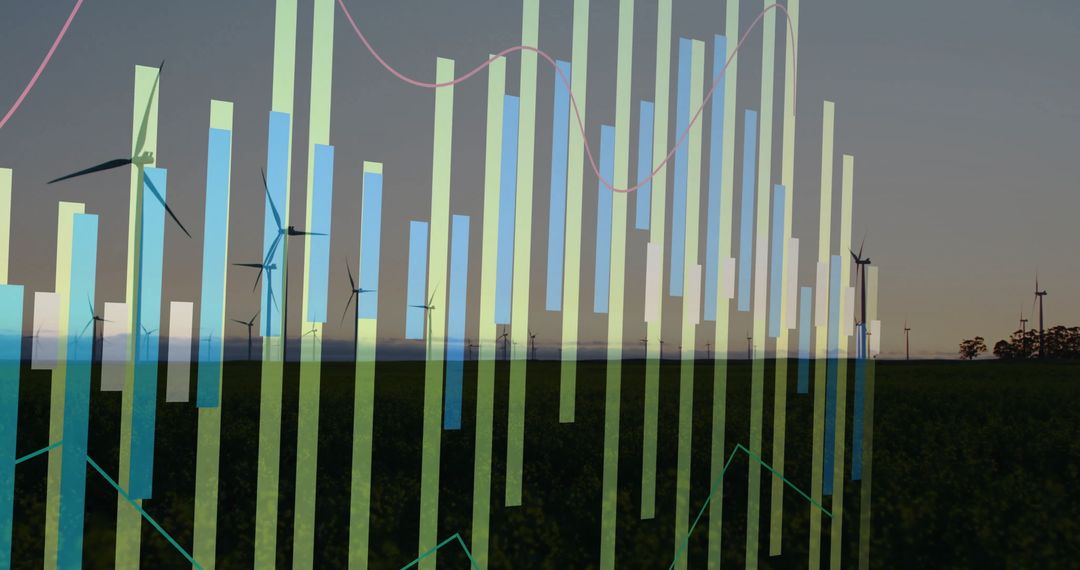
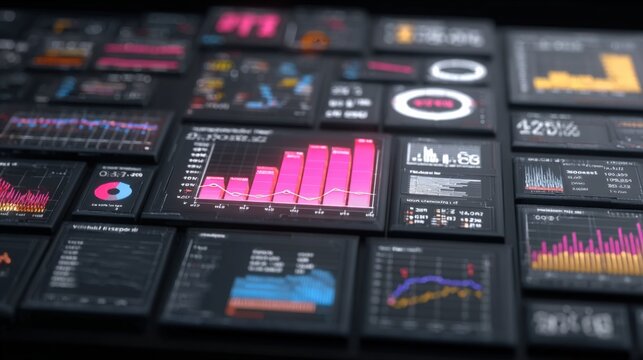
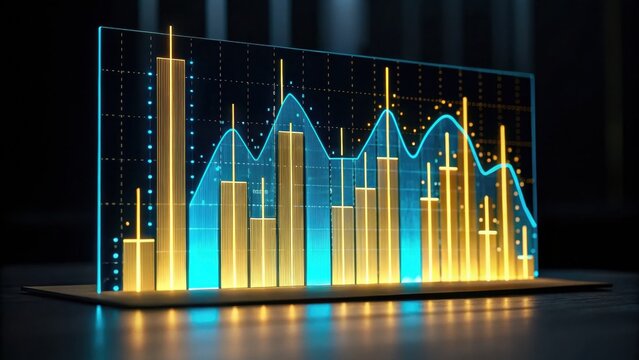
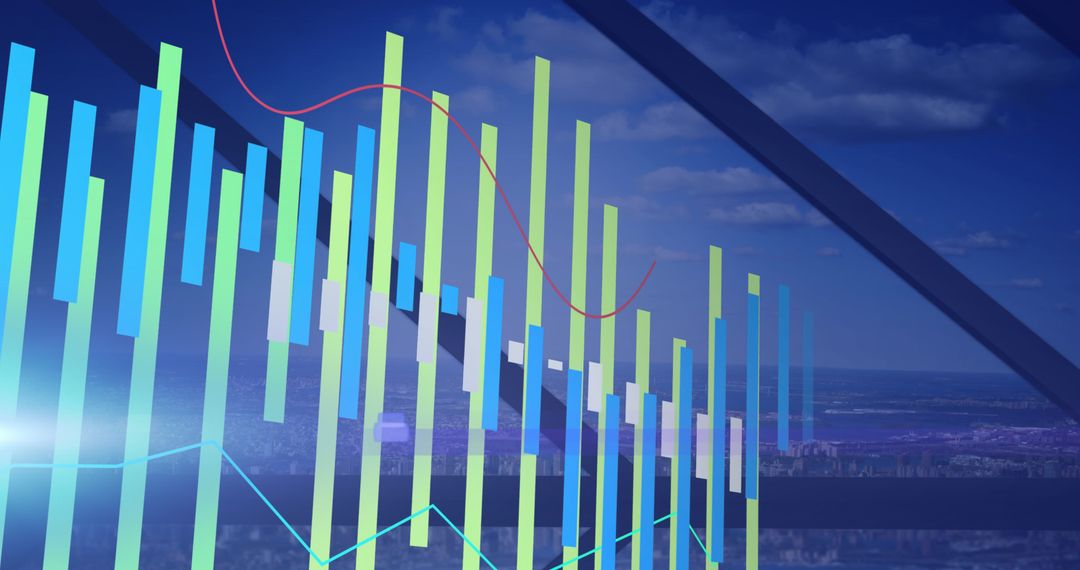
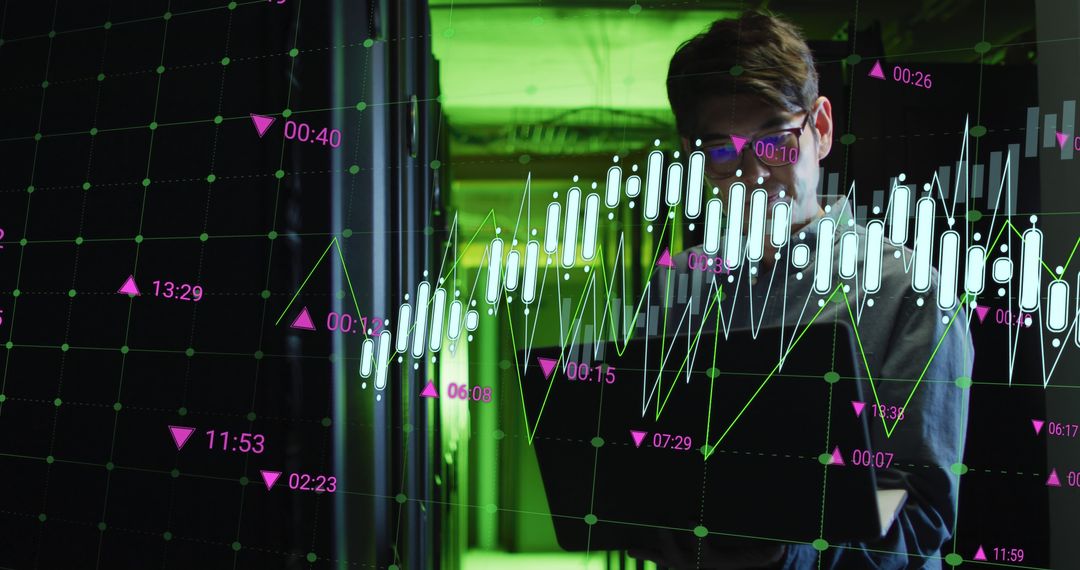
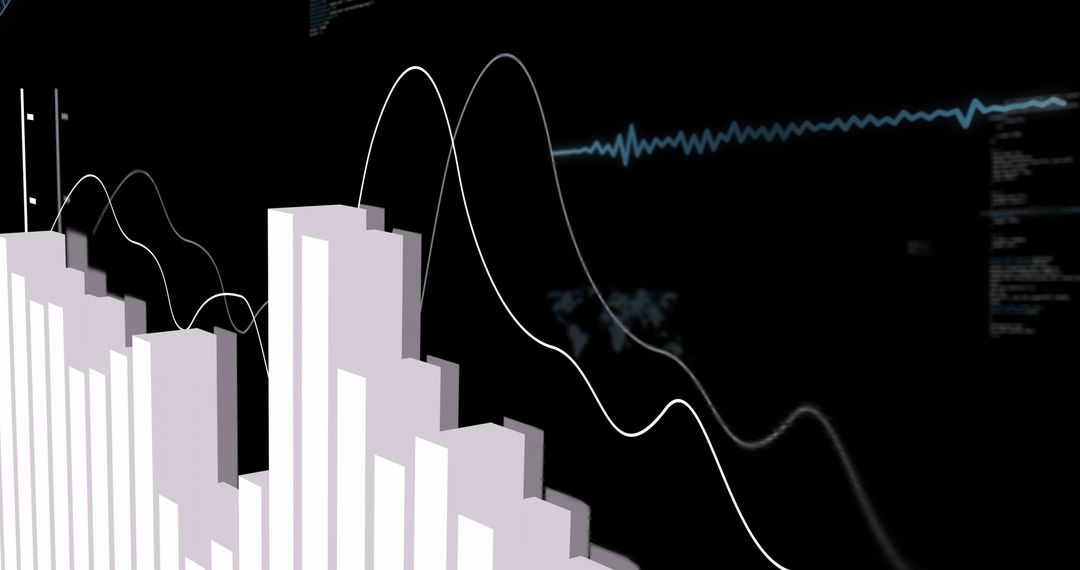
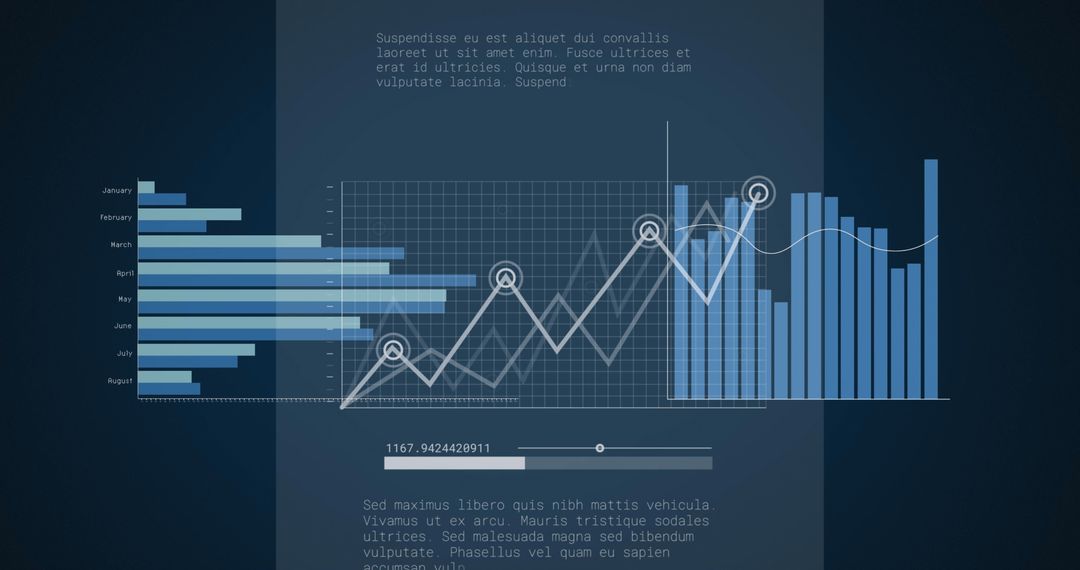
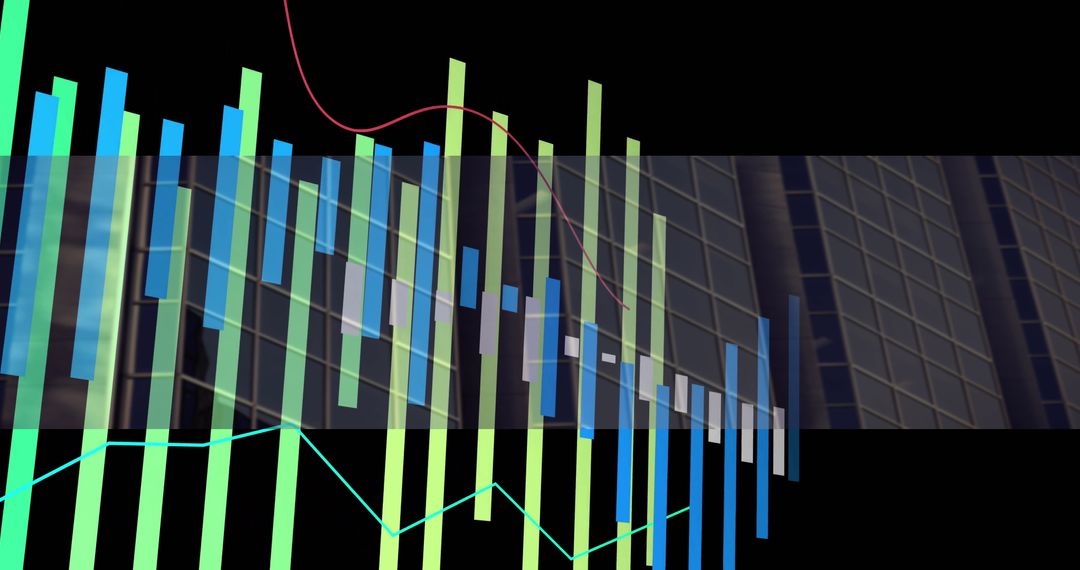
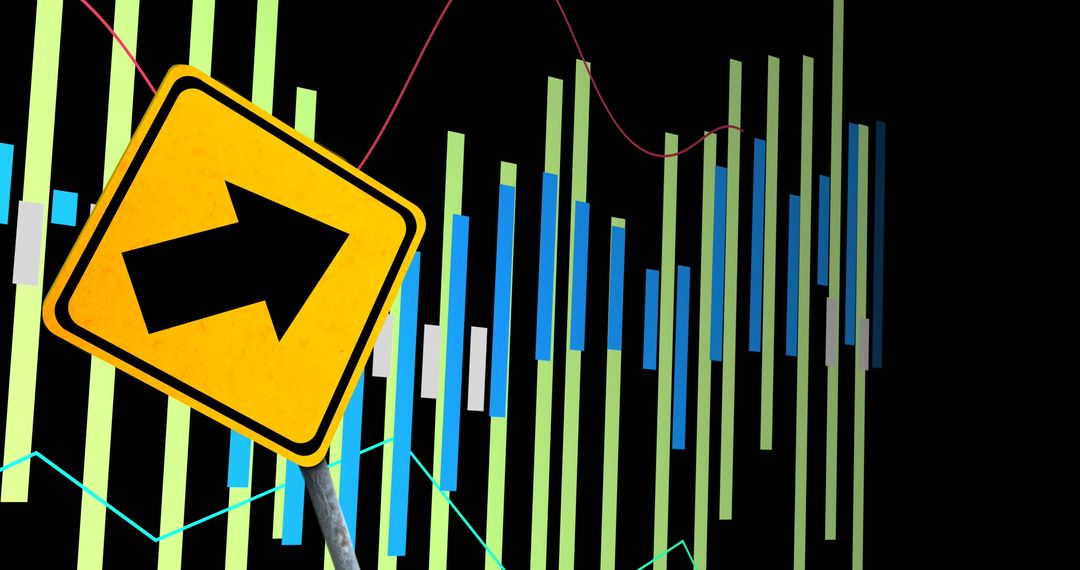
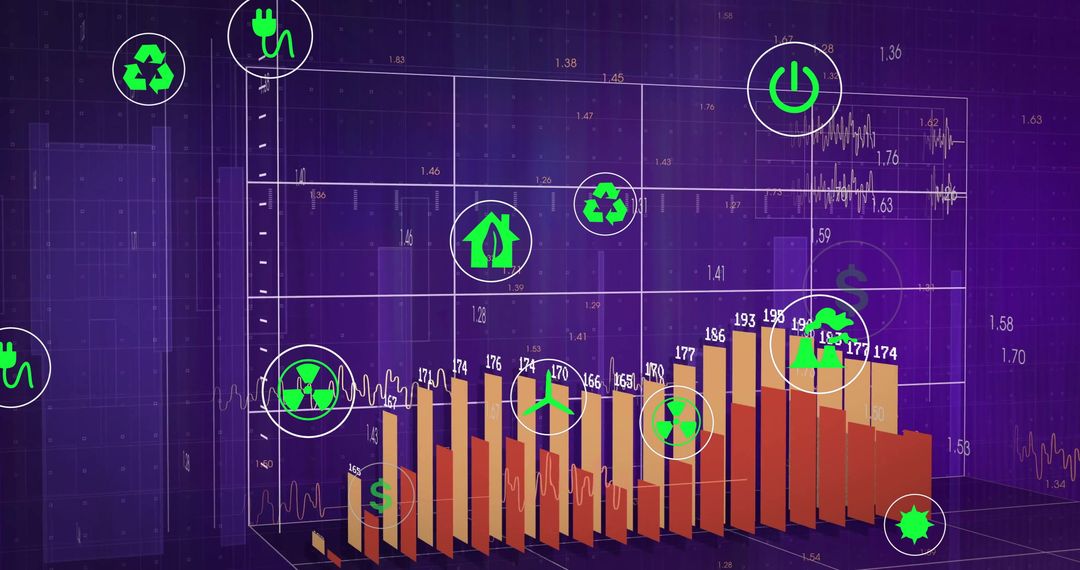
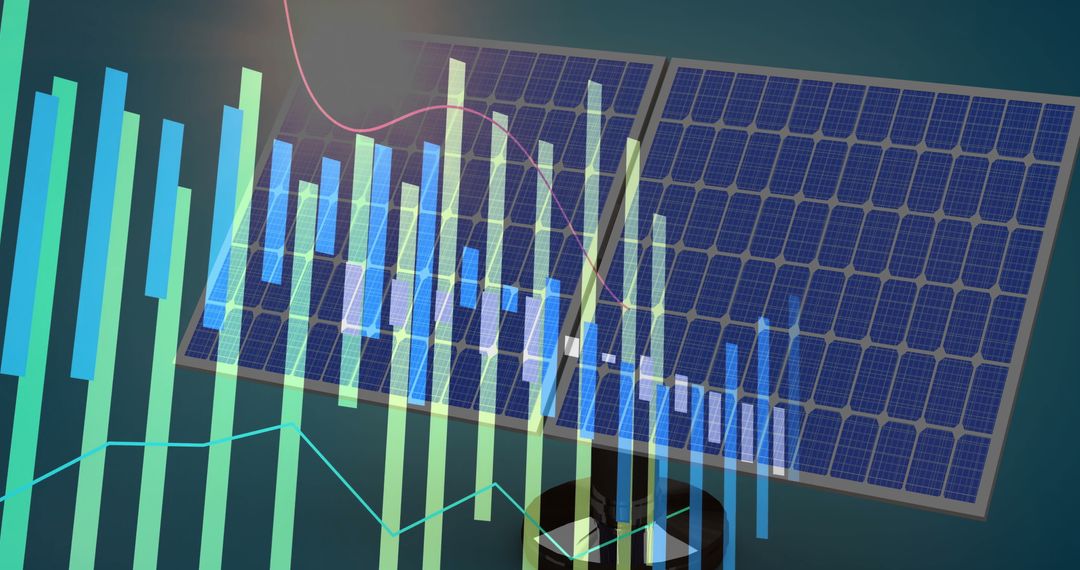
- Dynamic Financial Dashboard with Bar Charts and Graphs
Dynamic Financial Dashboard with Bar Charts and Graphs Image

Vibrant and informative depiction of a financial dashboard showcasing various financial metrics using bar charts, candlestick graphs, and dense digital data visualization. This is ideal for business and financial reports, adding visual appeal and clarity to presentations about market trends or business performance analysis in high-tech sectors.
Powered by 


2
downloads
downloads
Tags:
More
Credit Photo
If you would like to credit the Photo, here are some ways you can do so
Text Link
photo Link
<span class="text-link">
<span>
<a target="_blank" href=https://pikwizard.com/photo/dynamic-financial-dashboard-with-bar-charts-and-graphs/576856e8046a4728891daa7efa705bbe/>PikWizard</a>
</span>
</span>
<span class="image-link">
<span
style="margin: 0 0 20px 0; display: inline-block; vertical-align: middle; width: 100%;"
>
<a
target="_blank"
href="https://pikwizard.com/photo/dynamic-financial-dashboard-with-bar-charts-and-graphs/576856e8046a4728891daa7efa705bbe/"
style="text-decoration: none; font-size: 10px; margin: 0;"
>
<img src="https://pikwizard.com/pw/medium/576856e8046a4728891daa7efa705bbe.jpg" style="margin: 0; width: 100%;" alt="" />
<p style="font-size: 12px; margin: 0;">PikWizard</p>
</a>
</span>
</span>
Free (free of charge)
Free for personal and commercial use.
Author: Authentic Images
Similar Free Stock Images
Premium


Premium


Premium


Premium


Premium


Premium


Premium


Premium


Premium


Premium


Premium


Premium


Premium


Premium


Premium


Premium

Premium

Premium


Premium


Premium


Premium

Premium


Premium


Premium