- Home >
- Stock Photos >
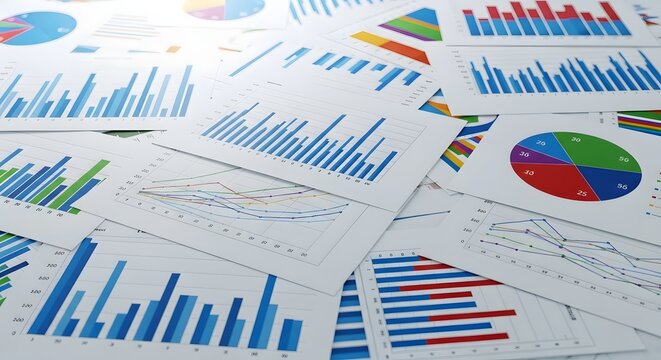
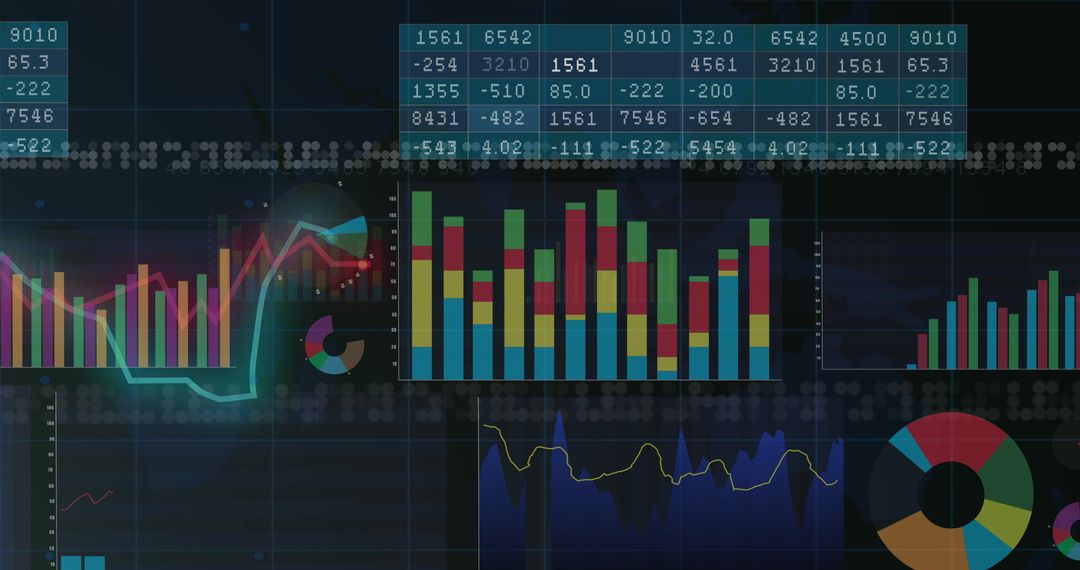
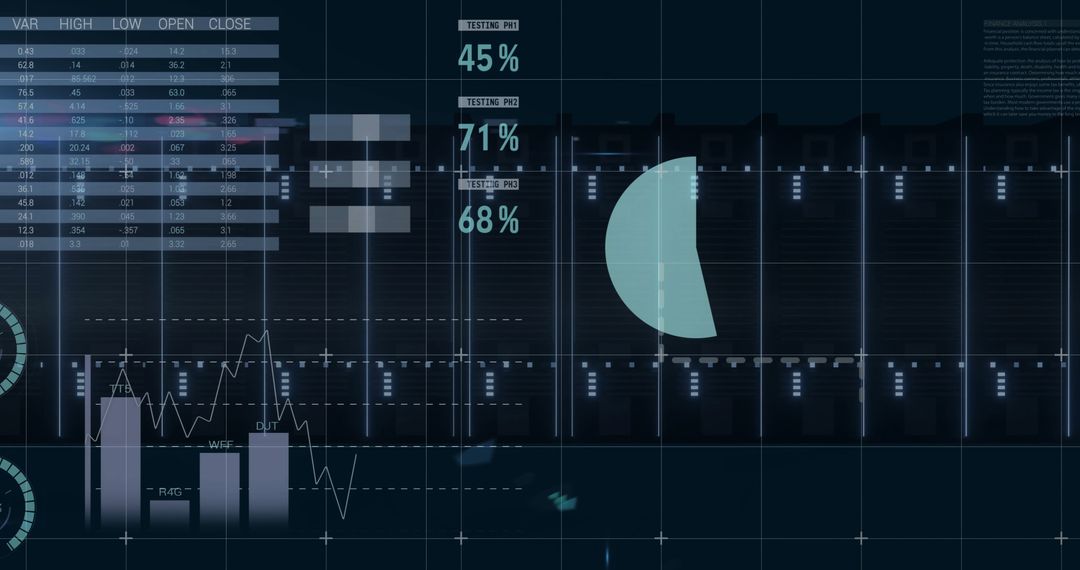
- Dynamic Financial Data Analysis and Graphs for Market Trends
Dynamic Financial Data Analysis and Graphs for Market Trends Image

Colorful financial data charts and graphs display dynamic market trends and statistics, illustrating complex data analysis. Useful for presentations on finance, business strategy, or investment analysis, as well as for educational materials focused on data analytics and financial modeling.
Powered by 


2
downloads
downloads
Tags:
More
Credit Photo
If you would like to credit the Photo, here are some ways you can do so
Text Link
photo Link
<span class="text-link">
<span>
<a target="_blank" href=https://pikwizard.com/photo/dynamic-financial-data-analysis-and-graphs-for-market-trends/98626feb2a4bef7979253d5b623596c1/>PikWizard</a>
</span>
</span>
<span class="image-link">
<span
style="margin: 0 0 20px 0; display: inline-block; vertical-align: middle; width: 100%;"
>
<a
target="_blank"
href="https://pikwizard.com/photo/dynamic-financial-data-analysis-and-graphs-for-market-trends/98626feb2a4bef7979253d5b623596c1/"
style="text-decoration: none; font-size: 10px; margin: 0;"
>
<img src="https://pikwizard.com/pw/medium/98626feb2a4bef7979253d5b623596c1.jpg" style="margin: 0; width: 100%;" alt="" />
<p style="font-size: 12px; margin: 0;">PikWizard</p>
</a>
</span>
</span>
Free (free of charge)
Free for personal and commercial use.
Author: Creative Art
Similar Free Stock Images

Premium


Premium


Premium


Premium


Premium


Premium


Premium


Premium


Premium


Premium


Premium


Premium


Premium


Premium


Premium


Premium


Premium


Premium


Premium


Premium


Premium


Premium


Premium


Premium