- Home >
- Stock Photos >
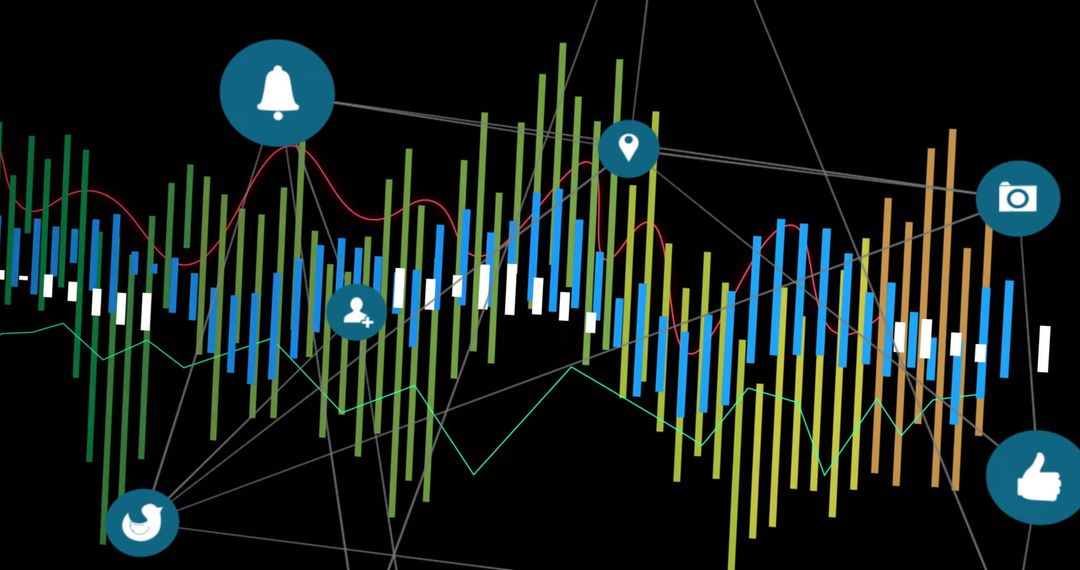
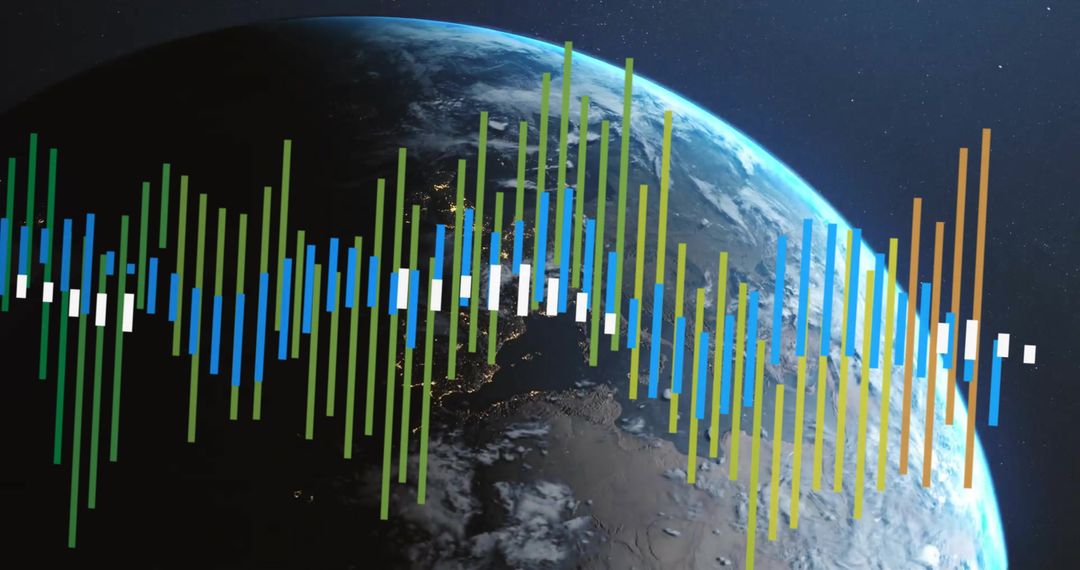
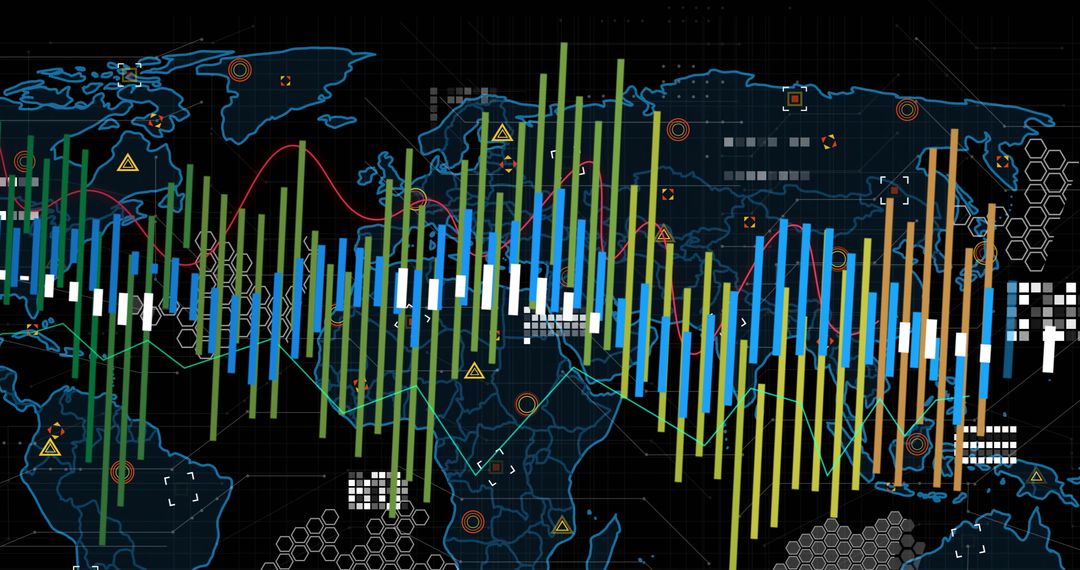
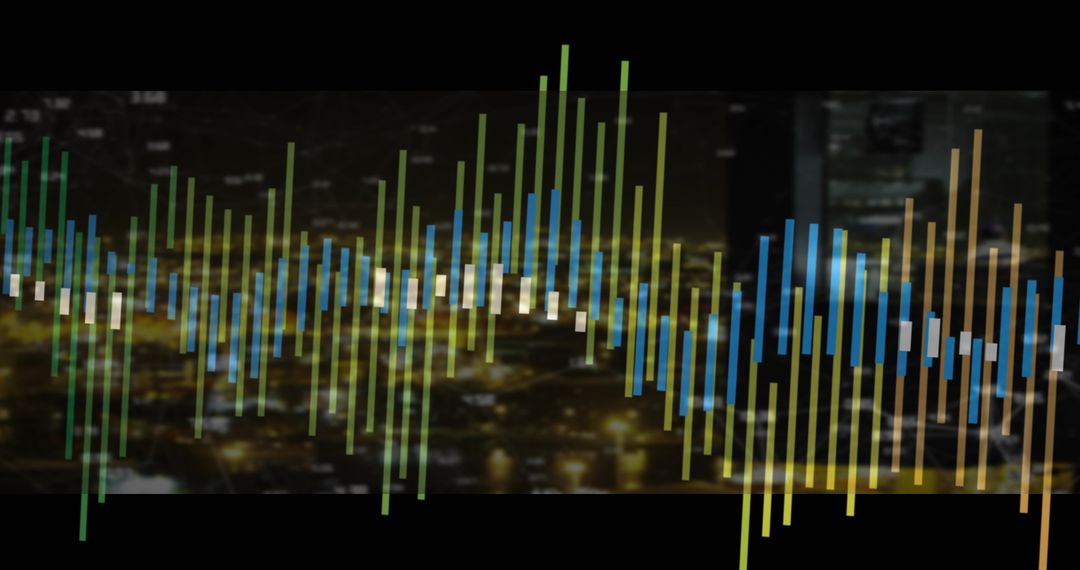
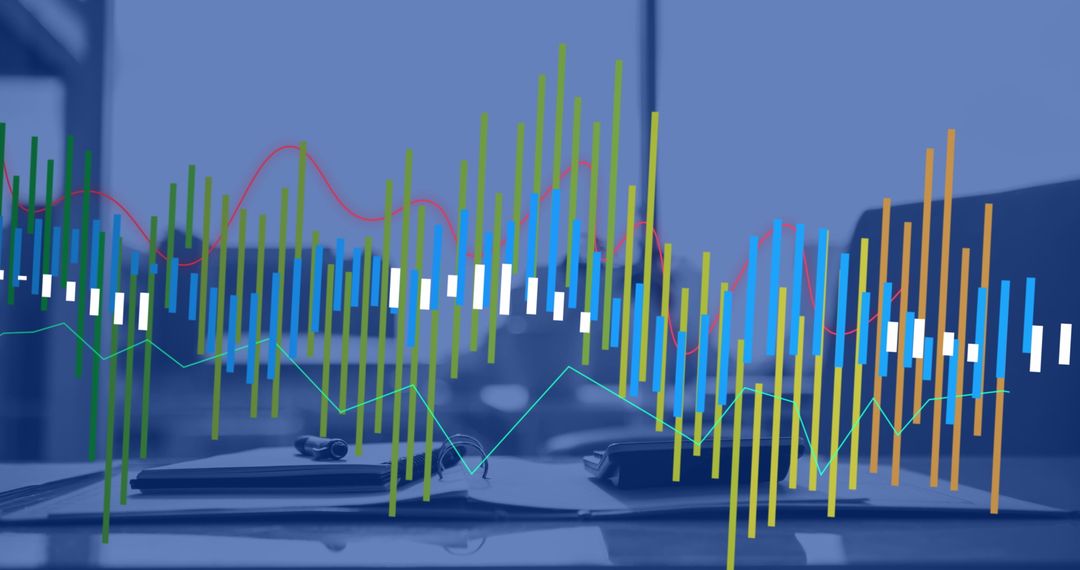
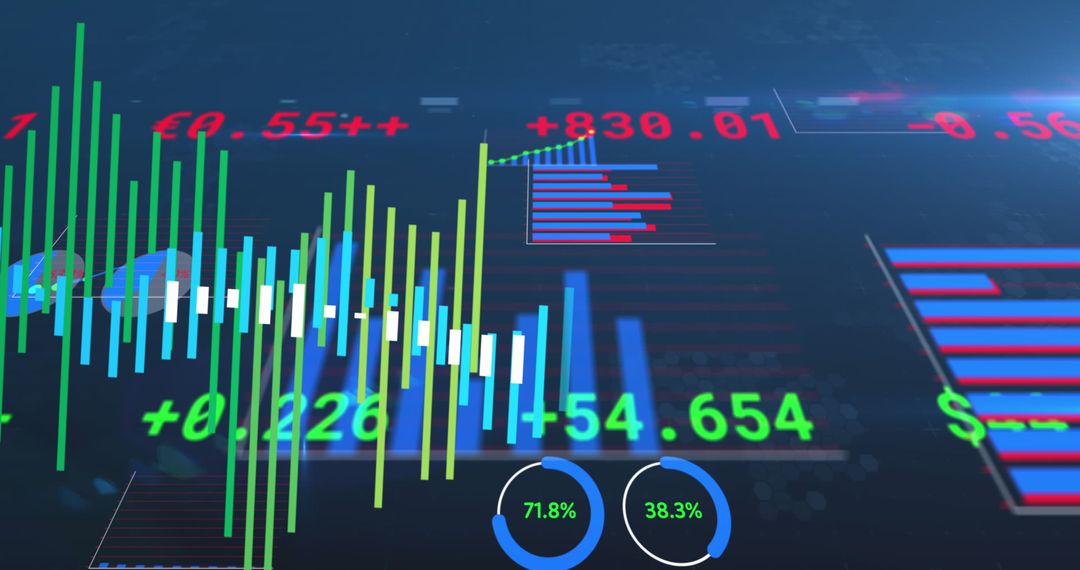
- Dynamic Financial Data Analysis With Abstract Global Background
Dynamic Financial Data Analysis With Abstract Global Background Image

Abstract representation of financial data processing with digital interface elements, ideal for illustrating topics related to global business and market analysis. Can be used in presentations, articles, or websites focused on finance, economics, and stock market trends.
Powered by  - Get 15% off with code: PIKWIZARD15


2
downloads
downloads
Tags:
More
Credit Photo
If you would like to credit the Photo, here are some ways you can do so
Text Link
photo Link
<span class="text-link">
<span>
<a target="_blank" href=https://pikwizard.com/photo/dynamic-financial-data-analysis-with-abstract-global-background/7217d81562591d1293453951f5bd33e8/>PikWizard</a>
</span>
</span>
<span class="image-link">
<span
style="margin: 0 0 20px 0; display: inline-block; vertical-align: middle; width: 100%;"
>
<a
target="_blank"
href="https://pikwizard.com/photo/dynamic-financial-data-analysis-with-abstract-global-background/7217d81562591d1293453951f5bd33e8/"
style="text-decoration: none; font-size: 10px; margin: 0;"
>
<img src="https://pikwizard.com/pw/medium/7217d81562591d1293453951f5bd33e8.jpg" style="margin: 0; width: 100%;" alt="" />
<p style="font-size: 12px; margin: 0;">PikWizard</p>
</a>
</span>
</span>
Free (free of charge)
Free for personal and commercial use.
Author: Creative Art
Similar Free Stock Images
Premium


Premium


Premium


Premium


Premium


Premium


Premium


Premium


Premium


Premium


Premium


Premium


Premium


Premium


Premium


Premium


Premium


Premium


Premium


Premium


Premium


Premium


Premium


Premium