- Home >
- Stock Photos >
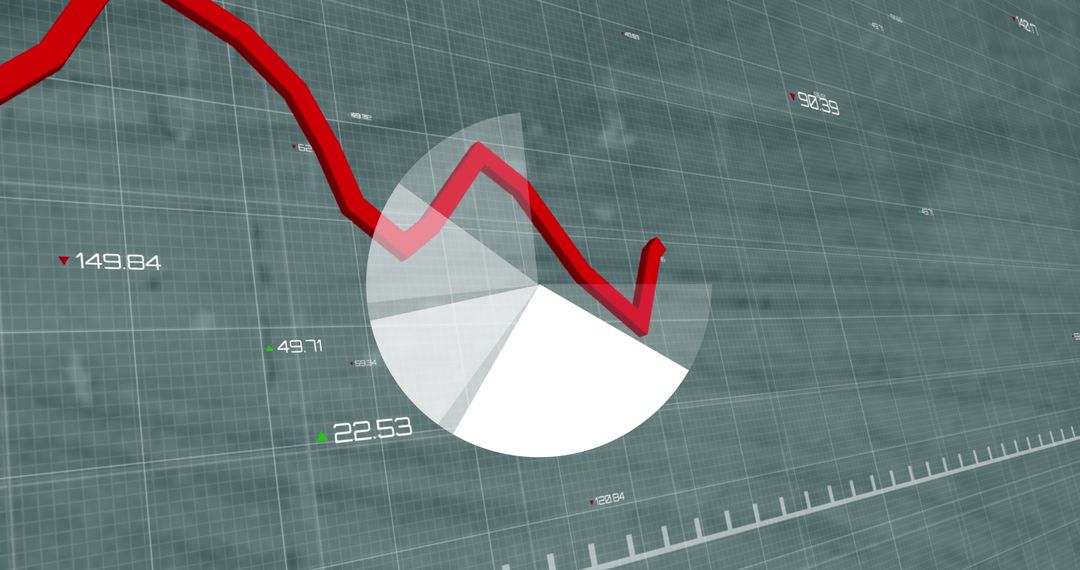
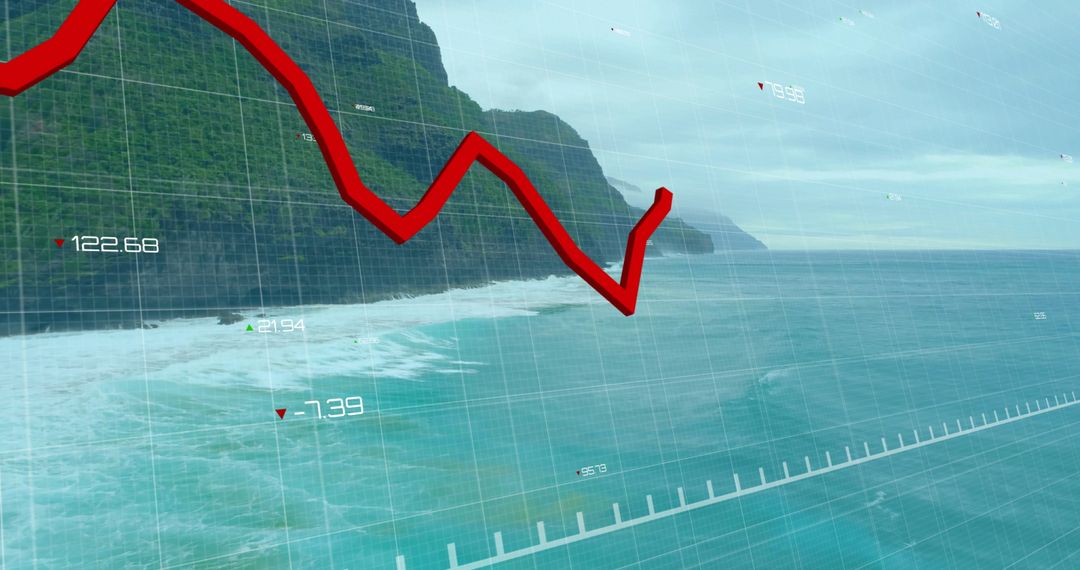
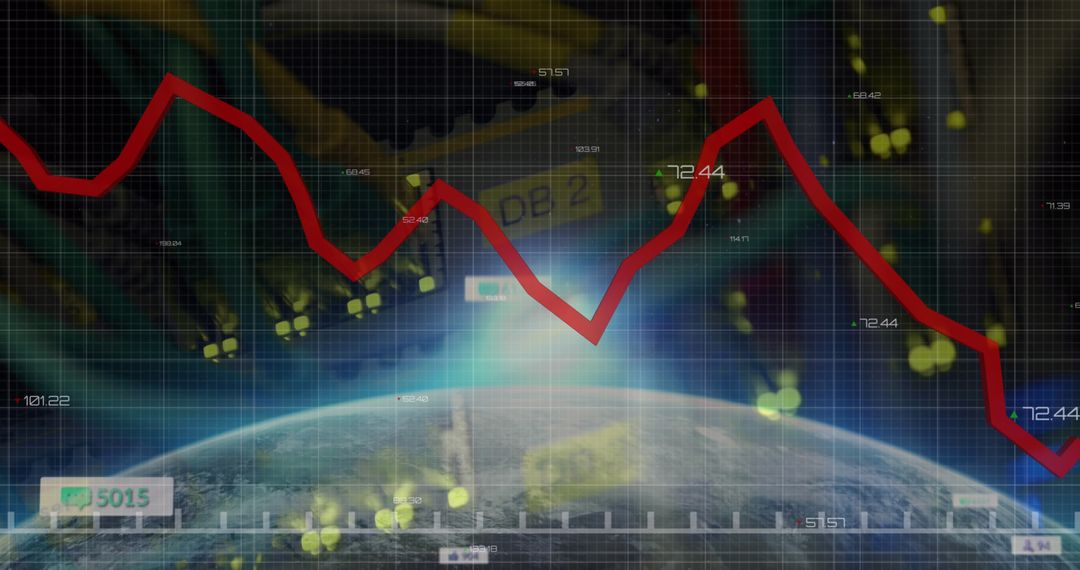
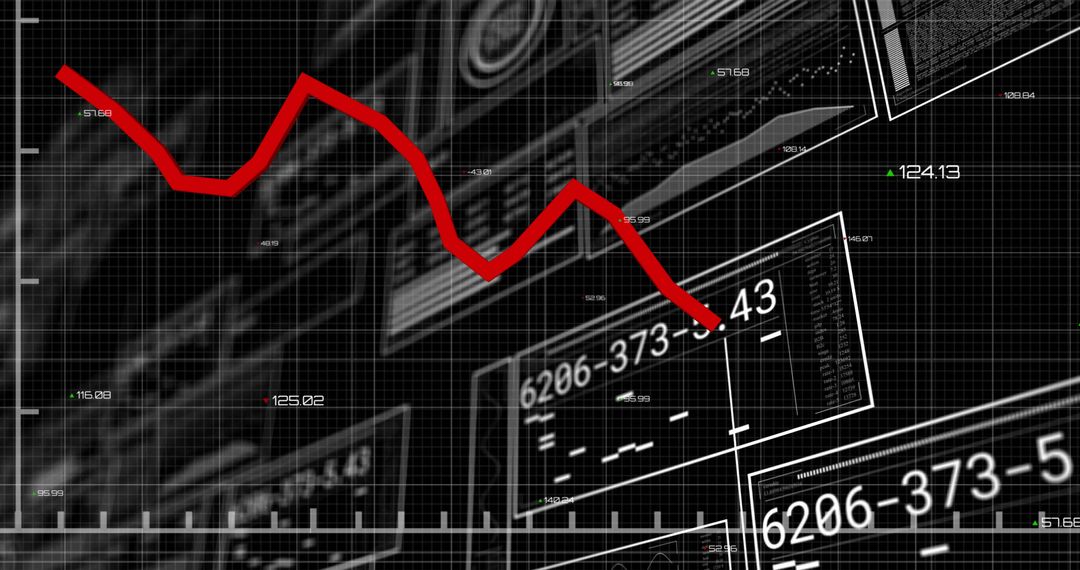
- Dynamic Financial Data Chart with Red Trend Line on Green Background
Dynamic Financial Data Chart with Red Trend Line on Green Background Image

In digital design showcasing red trend line on financial data grid, signifying analysis and pattern interpretation in economy context. Use for economy discussions, investment presentations and finance concepts representation, or media related to global financial markets.
Powered by 


2
downloads
downloads
Tags:
More
Credit Photo
If you would like to credit the Photo, here are some ways you can do so
Text Link
photo Link
<span class="text-link">
<span>
<a target="_blank" href=https://pikwizard.com/photo/dynamic-financial-data-chart-with-red-trend-line-on-green-background/12ebf9001db29aa06ae157e3519c705b/>PikWizard</a>
</span>
</span>
<span class="image-link">
<span
style="margin: 0 0 20px 0; display: inline-block; vertical-align: middle; width: 100%;"
>
<a
target="_blank"
href="https://pikwizard.com/photo/dynamic-financial-data-chart-with-red-trend-line-on-green-background/12ebf9001db29aa06ae157e3519c705b/"
style="text-decoration: none; font-size: 10px; margin: 0;"
>
<img src="https://pikwizard.com/pw/medium/12ebf9001db29aa06ae157e3519c705b.jpg" style="margin: 0; width: 100%;" alt="" />
<p style="font-size: 12px; margin: 0;">PikWizard</p>
</a>
</span>
</span>
Free (free of charge)
Free for personal and commercial use.
Author: People Creations
Similar Free Stock Images

Premium


Premium


Premium


Premium


Premium


Premium


Premium


Premium


Premium


Premium


Premium


Premium


Premium


Premium


Premium


Premium


Premium


Premium


Premium


Premium


Premium


Premium


Premium


Premium