- Home >
- Stock Photos >
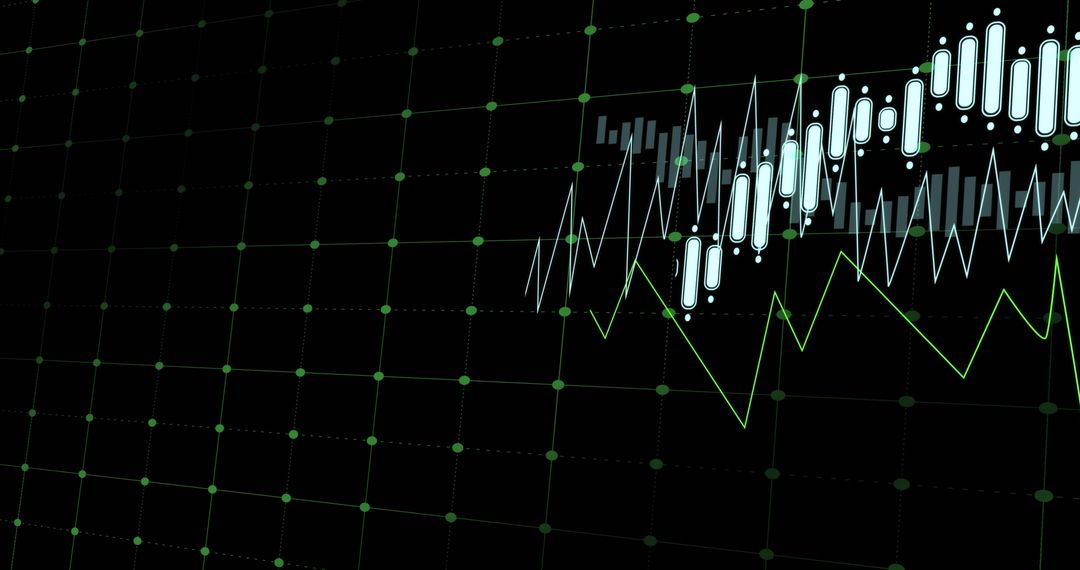
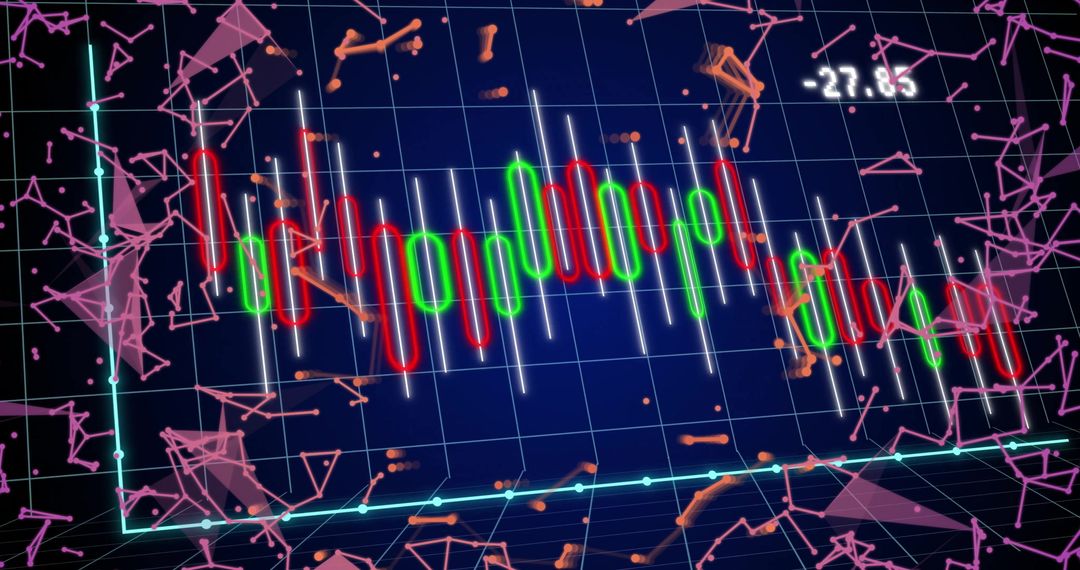
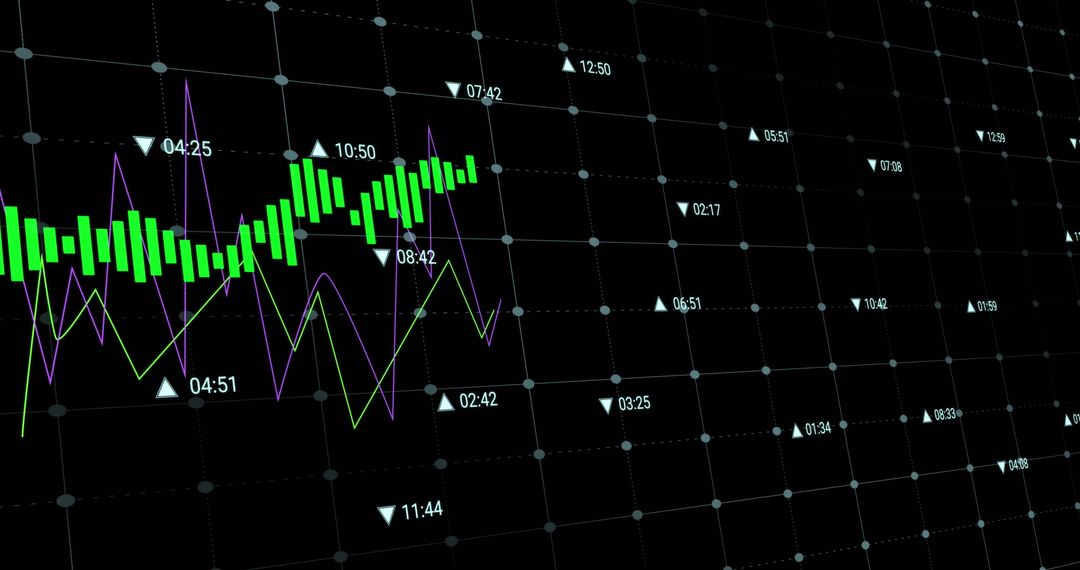
- Dynamic Financial Data Chart with Rising Bars and Trend Lines
Dynamic Financial Data Chart with Rising Bars and Trend Lines Image

The image showcases a vibrant financial data chart with various analytical elements, such as rising bars, a series of colored dots representing sequential points in data, and trend lines. Various numerical labels offer precise metrics facilitated by a polished, modern digital interface against a deep blue grid background. Useful for illustrating themes in corporate finance, technology, data-driven planning, strategic decision-making, and investment strategies. Applicable for presentations, reports, and educational materials focusing on business intelligence, financial modeling, or economics coursework.
Powered by 


2
downloads
downloads
Tags:
More
Credit Photo
If you would like to credit the Photo, here are some ways you can do so
Text Link
photo Link
<span class="text-link">
<span>
<a target="_blank" href=https://pikwizard.com/photo/dynamic-financial-data-chart-with-rising-bars-and-trend-lines/50279e62c0e7ebdf398216a5281a5577/>PikWizard</a>
</span>
</span>
<span class="image-link">
<span
style="margin: 0 0 20px 0; display: inline-block; vertical-align: middle; width: 100%;"
>
<a
target="_blank"
href="https://pikwizard.com/photo/dynamic-financial-data-chart-with-rising-bars-and-trend-lines/50279e62c0e7ebdf398216a5281a5577/"
style="text-decoration: none; font-size: 10px; margin: 0;"
>
<img src="https://pikwizard.com/pw/medium/50279e62c0e7ebdf398216a5281a5577.jpg" style="margin: 0; width: 100%;" alt="" />
<p style="font-size: 12px; margin: 0;">PikWizard</p>
</a>
</span>
</span>
Free (free of charge)
Free for personal and commercial use.
Author: People Creations