
- Home >
- Stock Photos >
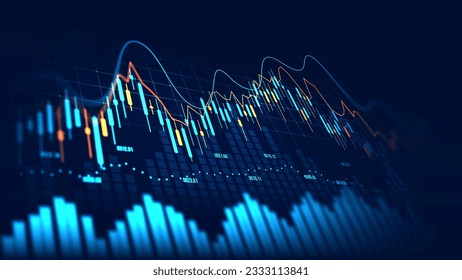
- Dynamic Financial Data Display Over Global Stock Market
Dynamic Financial Data Display Over Global Stock Market Image

Displays dynamic representation of financial data processing overlaid on digital stock market visuals, perfect for use in contexts involving global technology and digital finance. Ideal for illustrating trends in finance, business articles, presentations, financial tech solutions, or educational resources detailing data analytics in stock trading.
Powered by  - Get 15% off with code: PIKWIZARD15


2
downloads
downloads
Tags:
More
Credit Photo
If you would like to credit the Photo, here are some ways you can do so
Text Link
photo Link
<span class="text-link">
<span>
<a target="_blank" href=https://pikwizard.com/photo/dynamic-financial-data-display-over-global-stock-market/a1b514fe844a2625ffa3e128211a8cd1/>PikWizard</a>
</span>
</span>
<span class="image-link">
<span
style="margin: 0 0 20px 0; display: inline-block; vertical-align: middle; width: 100%;"
>
<a
target="_blank"
href="https://pikwizard.com/photo/dynamic-financial-data-display-over-global-stock-market/a1b514fe844a2625ffa3e128211a8cd1/"
style="text-decoration: none; font-size: 10px; margin: 0;"
>
<img src="https://pikwizard.com/pw/medium/a1b514fe844a2625ffa3e128211a8cd1.jpg" style="margin: 0; width: 100%;" alt="" />
<p style="font-size: 12px; margin: 0;">PikWizard</p>
</a>
</span>
</span>
Free (free of charge)
Free for personal and commercial use.
Author: Awesome Content
Similar Free Stock Images

Premium


Premium


Premium


Premium


Premium


Premium


Premium


Premium


Premium


Premium


Premium


Premium


Premium


Premium


Premium


Premium


Premium


Premium


Premium


Premium


Premium


Premium


Premium


Premium

