- Home >
- Stock Photos >
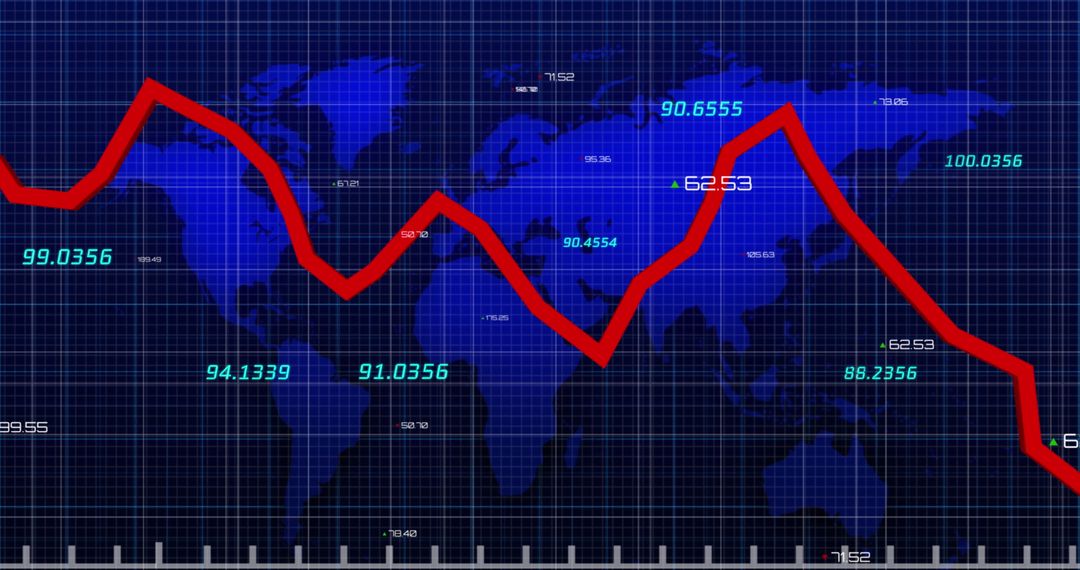
- Dynamic Financial Data Display with Market Decline Illustrated
Dynamic Financial Data Display with Market Decline Illustrated Image

Illustrates fluctuating financial market data with prominent decline. Perfect for use in finance or stock market reports, economic downturn analysis, business presentations, and blog articles on trading and investments.
Powered by 


0
downloads
downloads
Tags:
More
Credit Photo
If you would like to credit the Photo, here are some ways you can do so
Text Link
photo Link
<span class="text-link">
<span>
<a target="_blank" href=https://pikwizard.com/photo/dynamic-financial-data-display-with-market-decline-illustrated/daff52037abb3b7e5c12aa717988be17/>PikWizard</a>
</span>
</span>
<span class="image-link">
<span
style="margin: 0 0 20px 0; display: inline-block; vertical-align: middle; width: 100%;"
>
<a
target="_blank"
href="https://pikwizard.com/photo/dynamic-financial-data-display-with-market-decline-illustrated/daff52037abb3b7e5c12aa717988be17/"
style="text-decoration: none; font-size: 10px; margin: 0;"
>
<img src="https://pikwizard.com/pw/medium/daff52037abb3b7e5c12aa717988be17.jpg" style="margin: 0; width: 100%;" alt="" />
<p style="font-size: 12px; margin: 0;">PikWizard</p>
</a>
</span>
</span>
Free (free of charge)
Free for personal and commercial use.
Author: People Creations
Similar Free Stock Images
Premium


Premium


Premium


Premium


Premium


Premium


Premium


Premium


Premium


Premium


Premium


Premium


Premium


Premium


Premium


Premium


Premium


Premium


Premium


Premium


Premium


Premium


Premium


Premium