- Home >
- Stock Photos >
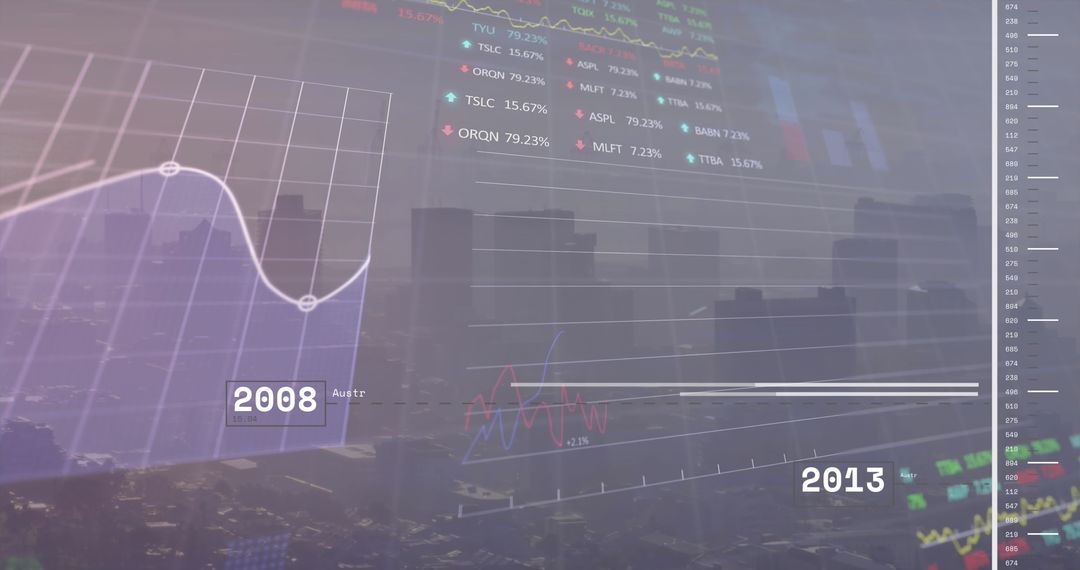
- Dynamic Financial Data Display with Stock Trends and Statistics
Dynamic Financial Data Display with Stock Trends and Statistics Image

Dynamic charts and graphs display detailed financial data and stock market trends. The use of bright colors highlights various statistics, making this visual ideal for presentations on investment strategies, financial analysis, and economic forecasting. It suits educational content, financial reports, and business strategies that require clear demonstration of market fluctuations.
Powered by  - Get 15% off with code: PIKWIZARD15


4
downloads
downloads
Tags:
More
Credit Photo
If you would like to credit the Photo, here are some ways you can do so
Text Link
photo Link
<span class="text-link">
<span>
<a target="_blank" href=https://pikwizard.com/photo/dynamic-financial-data-display-with-stock-trends-and-statistics/d46b2bf474d22020a73392f3de767b70/>PikWizard</a>
</span>
</span>
<span class="image-link">
<span
style="margin: 0 0 20px 0; display: inline-block; vertical-align: middle; width: 100%;"
>
<a
target="_blank"
href="https://pikwizard.com/photo/dynamic-financial-data-display-with-stock-trends-and-statistics/d46b2bf474d22020a73392f3de767b70/"
style="text-decoration: none; font-size: 10px; margin: 0;"
>
<img src="https://pikwizard.com/pw/medium/d46b2bf474d22020a73392f3de767b70.jpg" style="margin: 0; width: 100%;" alt="" />
<p style="font-size: 12px; margin: 0;">PikWizard</p>
</a>
</span>
</span>
Free (free of charge)
Free for personal and commercial use.
Author: Awesome Content
Similar Free Stock Images

Premium


Premium


Premium


Premium


Premium


Premium


Premium


Premium


Premium


Premium


Premium


Premium


Premium


Premium


Premium


Premium


Premium


Premium


Premium


Premium


Premium


Premium


Premium


Premium