
- Home >
- Stock Photos >
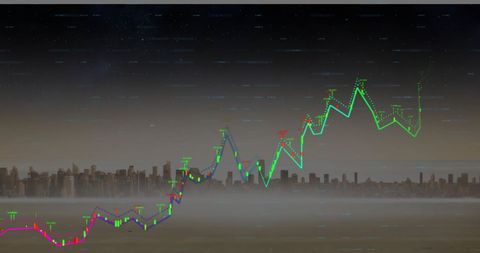
- Dynamic Financial Data with Fluctuating Stock Market Trends
Dynamic Financial Data with Fluctuating Stock Market Trends Image

Abstract depiction of financial data and stock market trends with a green fluctuating graph overlay. Helpful for illustrating concepts in finance and investment presentations, showcasing economic volatility, or designing informative layouts for traders, analysts, and educators.
Powered by  - Get 15% off with code: PIKWIZARD15


2
downloads
downloads
Tags:
More
Credit Photo
If you would like to credit the Photo, here are some ways you can do so
Text Link
photo Link
<span class="text-link">
<span>
<a target="_blank" href=https://pikwizard.com/photo/dynamic-financial-data-with-fluctuating-stock-market-trends/05a1392de36f4e0c287b97b886197158/>PikWizard</a>
</span>
</span>
<span class="image-link">
<span
style="margin: 0 0 20px 0; display: inline-block; vertical-align: middle; width: 100%;"
>
<a
target="_blank"
href="https://pikwizard.com/photo/dynamic-financial-data-with-fluctuating-stock-market-trends/05a1392de36f4e0c287b97b886197158/"
style="text-decoration: none; font-size: 10px; margin: 0;"
>
<img src="https://pikwizard.com/pw/medium/05a1392de36f4e0c287b97b886197158.jpg" style="margin: 0; width: 100%;" alt="" />
<p style="font-size: 12px; margin: 0;">PikWizard</p>
</a>
</span>
</span>
Free (free of charge)
Free for personal and commercial use.
Author: Authentic Images
Similar Free Stock Images

Premium


Premium


Premium


Premium


Premium


Premium


Premium


Premium


Premium


Premium


Premium


Premium


Premium


Premium


Premium


Premium


Premium


Premium


Premium


Premium


Premium


Premium


Premium


Premium


Premium

