- Home >
- Stock Photos >
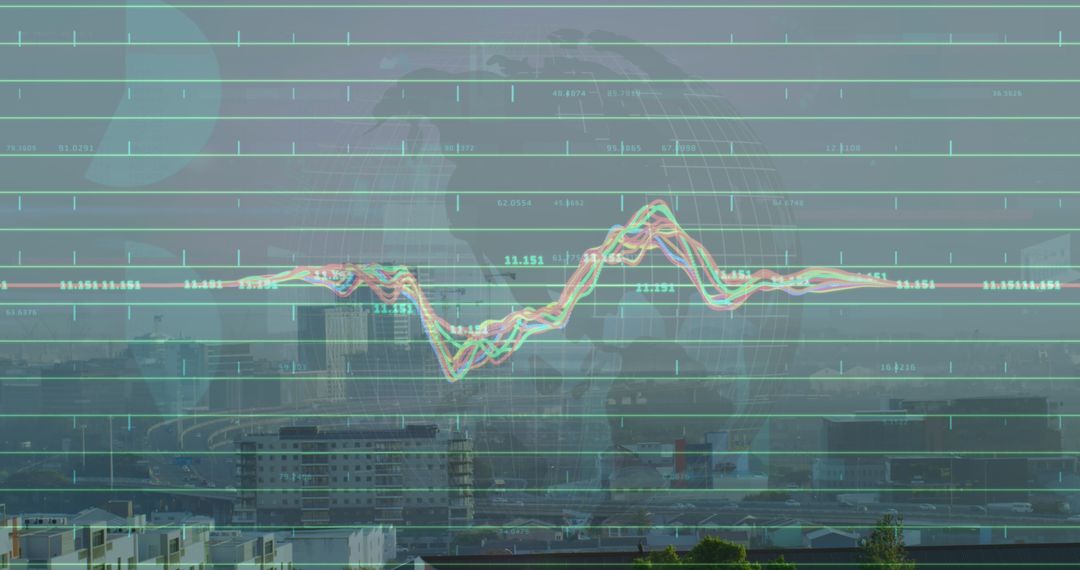
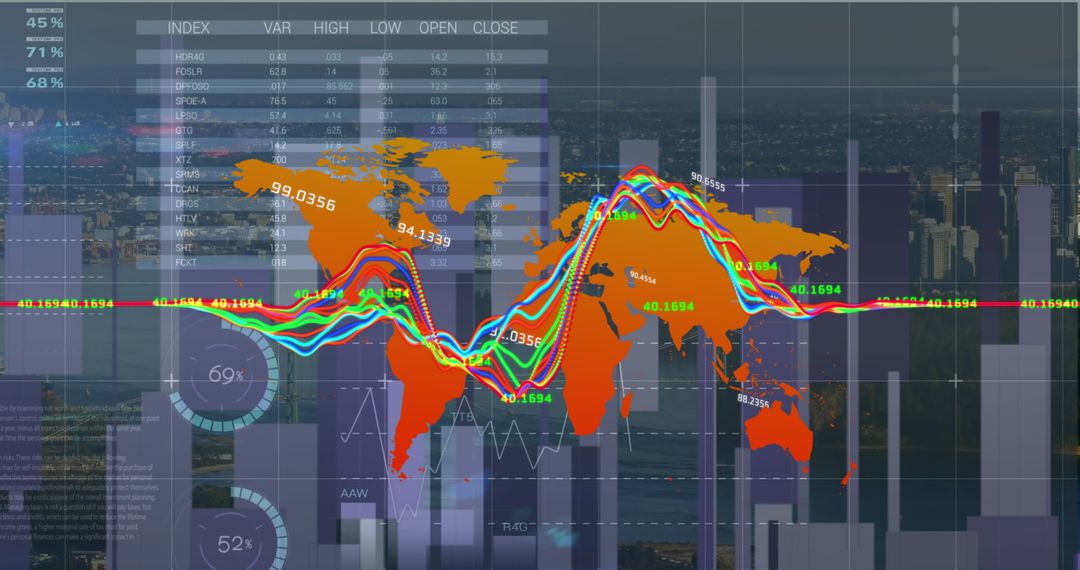
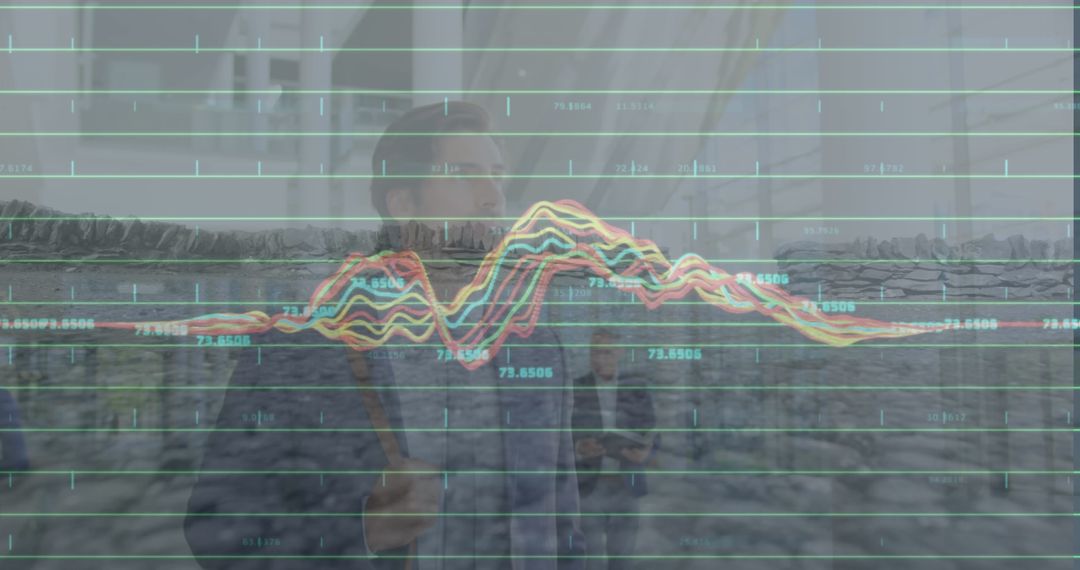
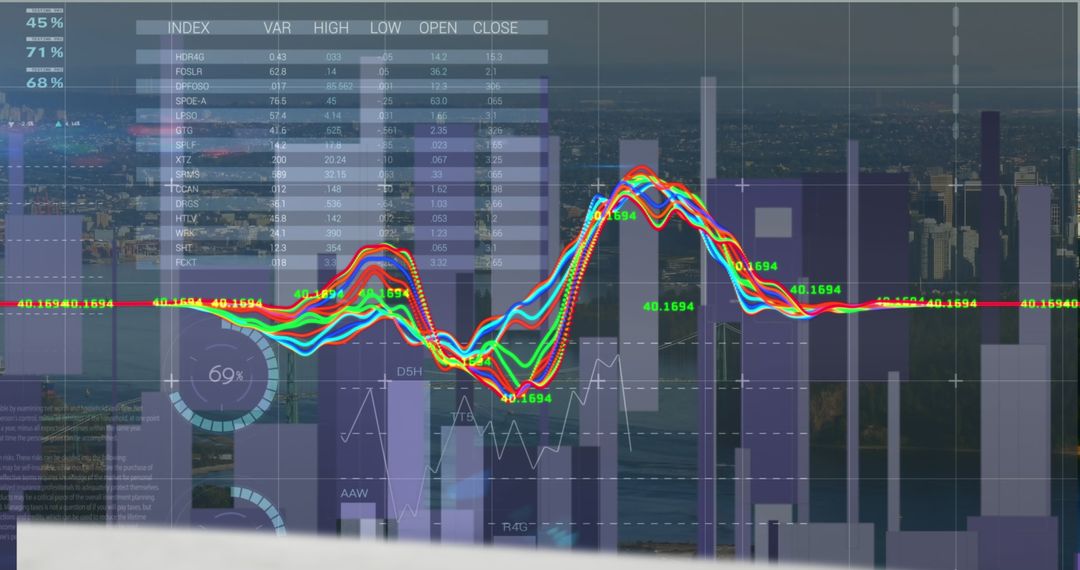
- Dynamic Financial Data with Vibrant Graph Overlay
Dynamic Financial Data with Vibrant Graph Overlay Image

Depicting vibrant financial trends and dynamic graphs overlaying a cityscape. The contrast of colorful lines with data blocks reflect economic fluctuations. Ideal for representing stock market analysis, economic articles, corporate reports, or financial technology visuals.
Powered by 


4
downloads
downloads
Tags:
More
Credit Photo
If you would like to credit the Photo, here are some ways you can do so
Text Link
photo Link
<span class="text-link">
<span>
<a target="_blank" href=https://pikwizard.com/photo/dynamic-financial-data-with-vibrant-graph-overlay/750276f611c1378738c394351ababf1d/>PikWizard</a>
</span>
</span>
<span class="image-link">
<span
style="margin: 0 0 20px 0; display: inline-block; vertical-align: middle; width: 100%;"
>
<a
target="_blank"
href="https://pikwizard.com/photo/dynamic-financial-data-with-vibrant-graph-overlay/750276f611c1378738c394351ababf1d/"
style="text-decoration: none; font-size: 10px; margin: 0;"
>
<img src="https://pikwizard.com/pw/medium/750276f611c1378738c394351ababf1d.jpg" style="margin: 0; width: 100%;" alt="" />
<p style="font-size: 12px; margin: 0;">PikWizard</p>
</a>
</span>
</span>
Free (free of charge)
Free for personal and commercial use.
Author: Authentic Images
Similar Free Stock Images

Premium


Premium


Premium


Premium


Premium


Premium


Premium


Premium


Premium


Premium


Premium


Premium


Premium


Premium


Premium


Premium


Premium


Premium


Premium


Premium


Premium


Premium


Premium


Premium