- Home >
- Stock Photos >
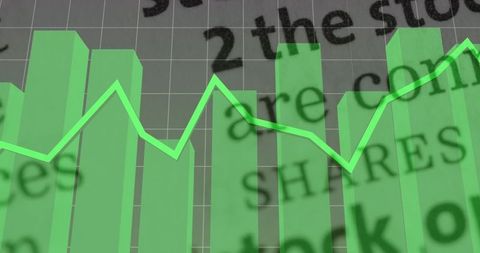
- Dynamic Financial Graph with Bar Chart on Digital Grid
Dynamic Financial Graph with Bar Chart on Digital Grid Image

This illustration displays financial market trends through a dynamic bar chart overlaid on a digital grid. Its shades of green suggest positivity and growth. This visually engaging concept can be utilized for presentations on stock market analysis, financial predictions, or any material related to global economics and investment trends.
Powered by 


2
downloads
downloads
Tags:
More
Credit Photo
If you would like to credit the Photo, here are some ways you can do so
Text Link
photo Link
<span class="text-link">
<span>
<a target="_blank" href=https://pikwizard.com/photo/dynamic-financial-graph-with-bar-chart-on-digital-grid/9b908ca797635f578ae4c45012958048/>PikWizard</a>
</span>
</span>
<span class="image-link">
<span
style="margin: 0 0 20px 0; display: inline-block; vertical-align: middle; width: 100%;"
>
<a
target="_blank"
href="https://pikwizard.com/photo/dynamic-financial-graph-with-bar-chart-on-digital-grid/9b908ca797635f578ae4c45012958048/"
style="text-decoration: none; font-size: 10px; margin: 0;"
>
<img src="https://pikwizard.com/pw/medium/9b908ca797635f578ae4c45012958048.jpg" style="margin: 0; width: 100%;" alt="" />
<p style="font-size: 12px; margin: 0;">PikWizard</p>
</a>
</span>
</span>
Free (free of charge)
Free for personal and commercial use.
Author: People Creations
Similar Free Stock Images

Premium


Premium


Premium


Premium


Premium


Premium


Premium


Premium


Premium


Premium


Premium


Premium


Premium


Premium


Premium


Premium


Premium


Premium


Premium


Premium


Premium


Premium


Premium


Premium


Premium