- Home >
- Stock Photos >
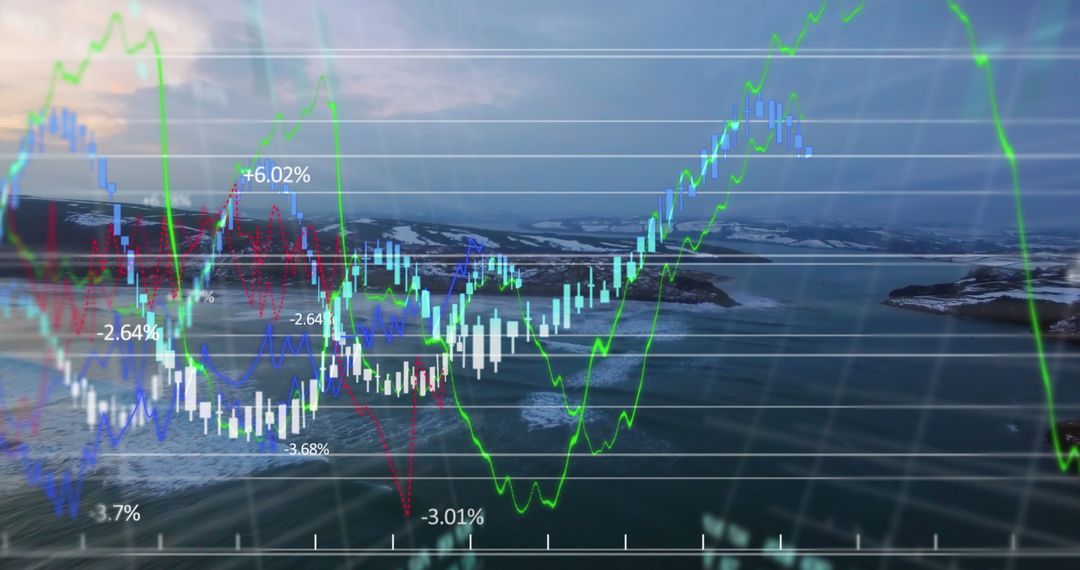
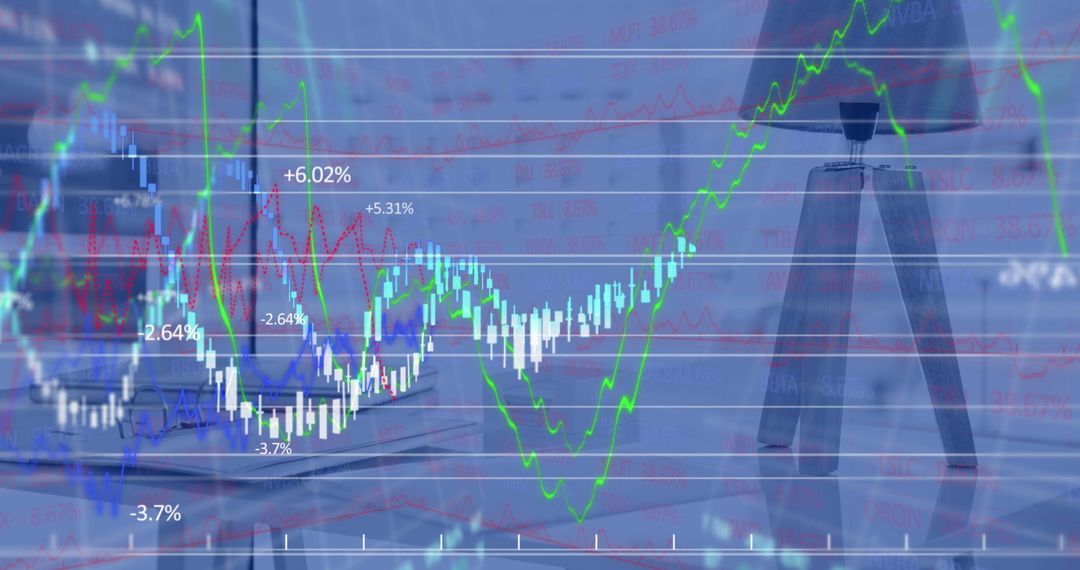
- Dynamic Financial Graphs Illustrating Stock Market Data
Dynamic Financial Graphs Illustrating Stock Market Data Image

Successful conveyance of market analysis through a blend of candlestick charts and line graphs, showcasing dynamic movement in percentages. Perfect for use in financial blogs, market analysis presentations, educational content around trading, investments, and technology interfaces guiding finance applications. Represents technological innovation within stock exchange interpretations.
Powered by  - Get 15% off with code: PIKWIZARD15


0
downloads
downloads
Tags:
More
Credit Photo
If you would like to credit the Photo, here are some ways you can do so
Text Link
photo Link
<span class="text-link">
<span>
<a target="_blank" href=https://pikwizard.com/photo/dynamic-financial-graphs-illustrating-stock-market-data/1582bbdf9d25ae6ddd396e7ee844aebd/>PikWizard</a>
</span>
</span>
<span class="image-link">
<span
style="margin: 0 0 20px 0; display: inline-block; vertical-align: middle; width: 100%;"
>
<a
target="_blank"
href="https://pikwizard.com/photo/dynamic-financial-graphs-illustrating-stock-market-data/1582bbdf9d25ae6ddd396e7ee844aebd/"
style="text-decoration: none; font-size: 10px; margin: 0;"
>
<img src="https://pikwizard.com/pw/medium/1582bbdf9d25ae6ddd396e7ee844aebd.jpg" style="margin: 0; width: 100%;" alt="" />
<p style="font-size: 12px; margin: 0;">PikWizard</p>
</a>
</span>
</span>
Free (free of charge)
Free for personal and commercial use.
Author: Authentic Images
Similar Free Stock Images

Premium


Premium


Premium


Premium


Premium


Premium


Premium


Premium


Premium


Premium


Premium


Premium


Premium


Premium


Premium


Premium


Premium


Premium


Premium


Premium


Premium


Premium


Premium


Premium