- Home >
- Stock Photos >
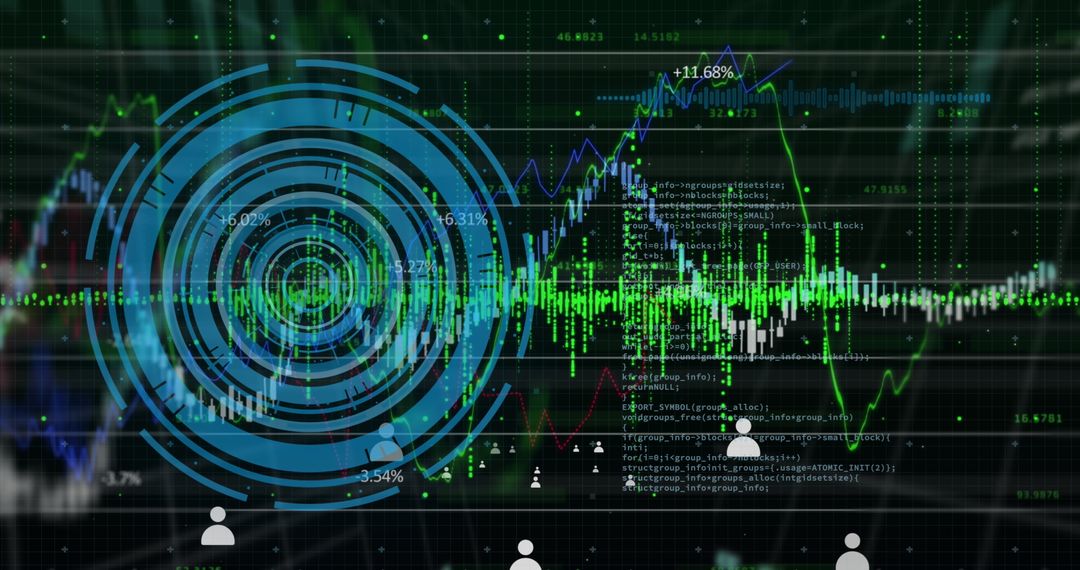
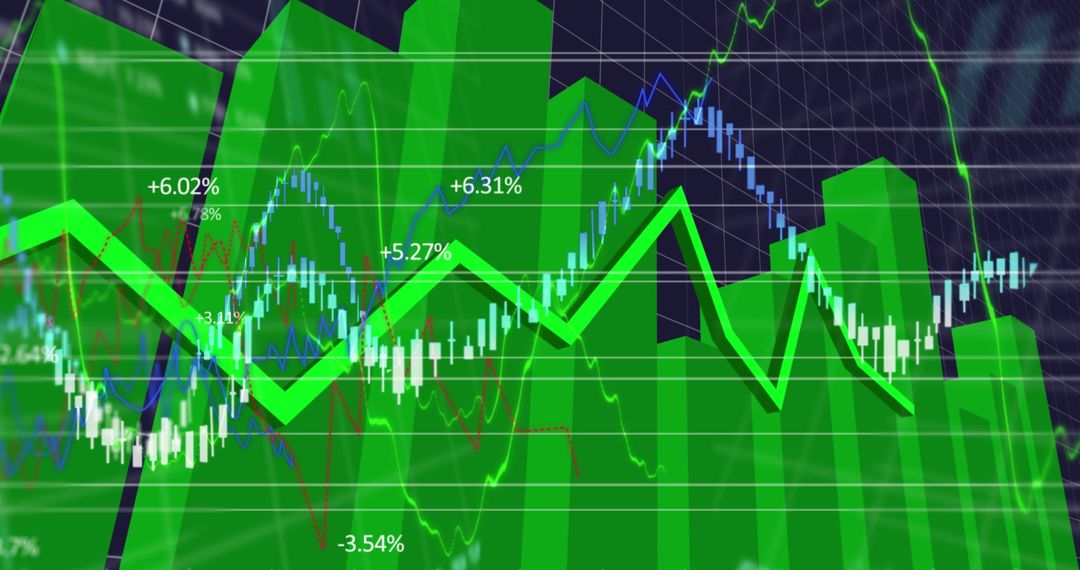
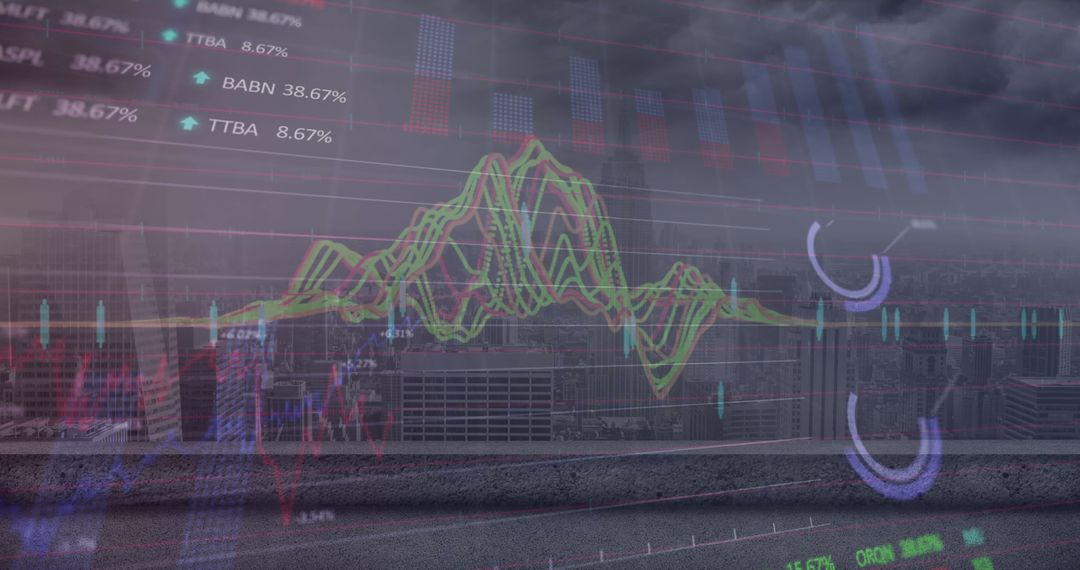
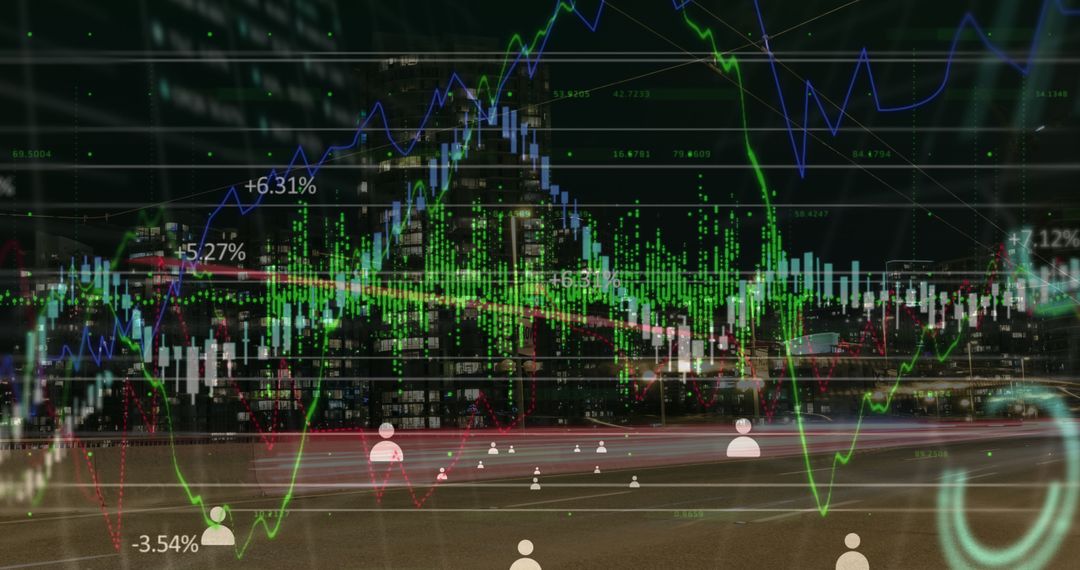
- Dynamic Financial Graphs on Dark Background with Digital Metrics
Dynamic Financial Graphs on Dark Background with Digital Metrics Image
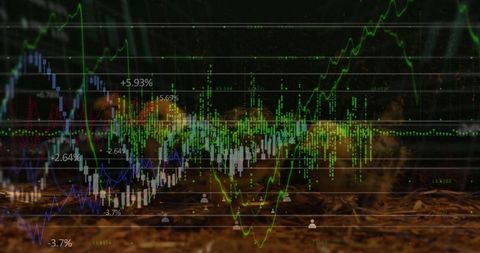
Financial graphs and metrics are depicted against a dark backdrop, highlighting dynamic trends in business and economy. Useful for illustrating concepts in economics, investment strategies, and financial analysis. Can be used in presentations, reports, and educational materials about market trends or financial forecasting.
Powered by 


2
downloads
downloads
Tags:
More
Credit Photo
If you would like to credit the Photo, here are some ways you can do so
Text Link
photo Link
<span class="text-link">
<span>
<a target="_blank" href=https://pikwizard.com/photo/dynamic-financial-graphs-on-dark-background-with-digital-metrics/1a481a654d056937050fb0844b0dee12/>PikWizard</a>
</span>
</span>
<span class="image-link">
<span
style="margin: 0 0 20px 0; display: inline-block; vertical-align: middle; width: 100%;"
>
<a
target="_blank"
href="https://pikwizard.com/photo/dynamic-financial-graphs-on-dark-background-with-digital-metrics/1a481a654d056937050fb0844b0dee12/"
style="text-decoration: none; font-size: 10px; margin: 0;"
>
<img src="https://pikwizard.com/pw/medium/1a481a654d056937050fb0844b0dee12.jpg" style="margin: 0; width: 100%;" alt="" />
<p style="font-size: 12px; margin: 0;">PikWizard</p>
</a>
</span>
</span>
Free (free of charge)
Free for personal and commercial use.
Author: People Creations
Similar Free Stock Images

Premium


Premium


Premium


Premium


Premium


Premium


Premium


Premium


Premium


Premium


Premium


Premium


Premium


Premium


Premium


Premium


Premium


Premium


Premium


Premium


Premium


Premium


Premium


Premium