- Home >
- Stock Photos >
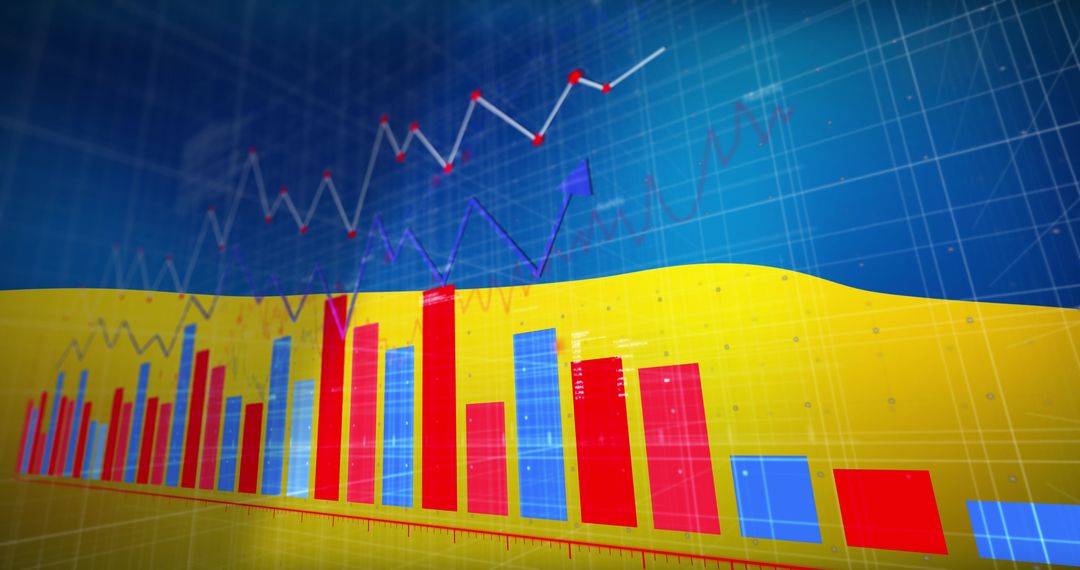
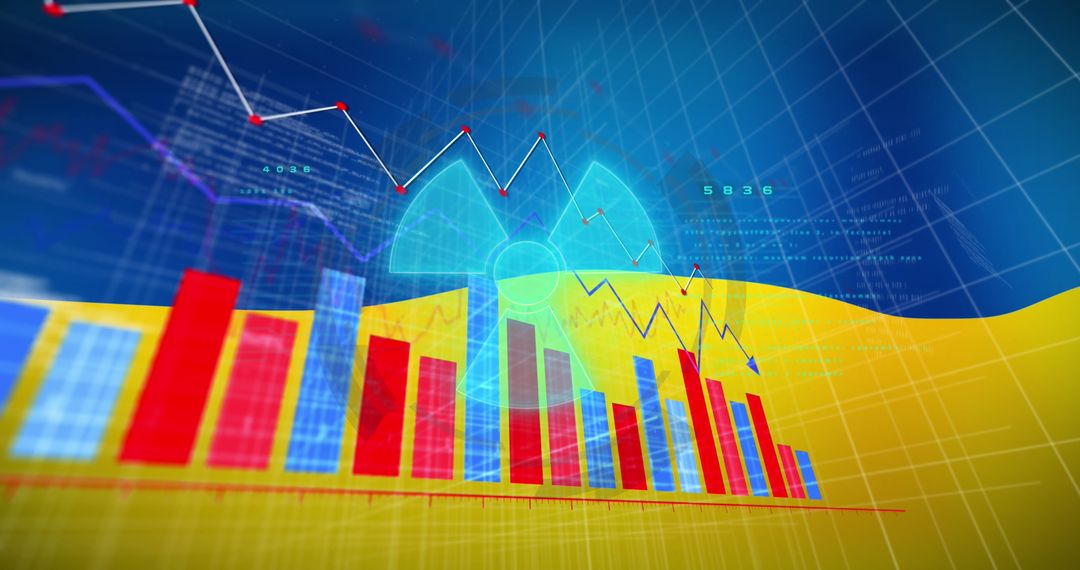
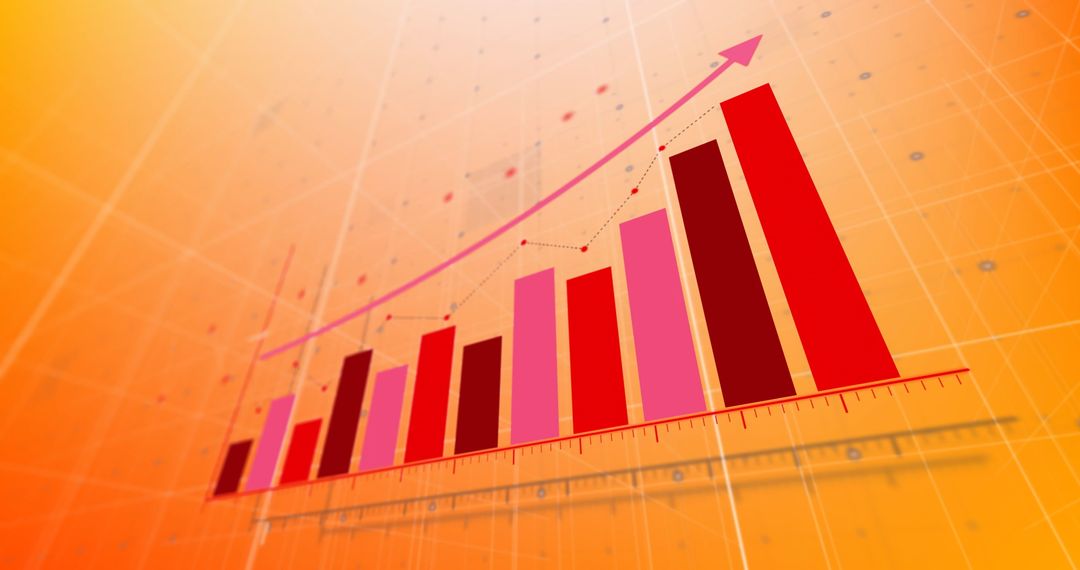
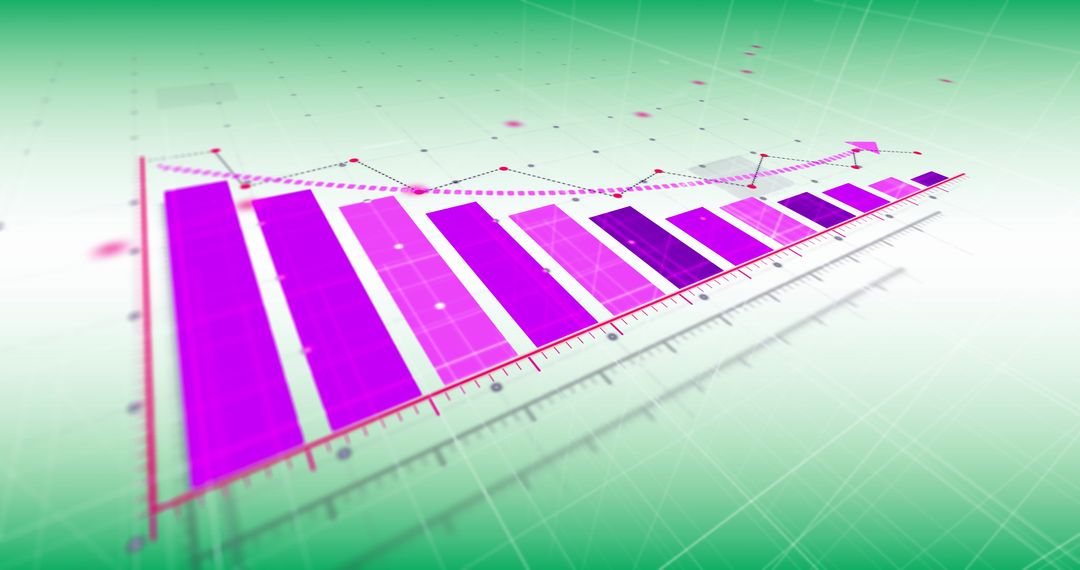
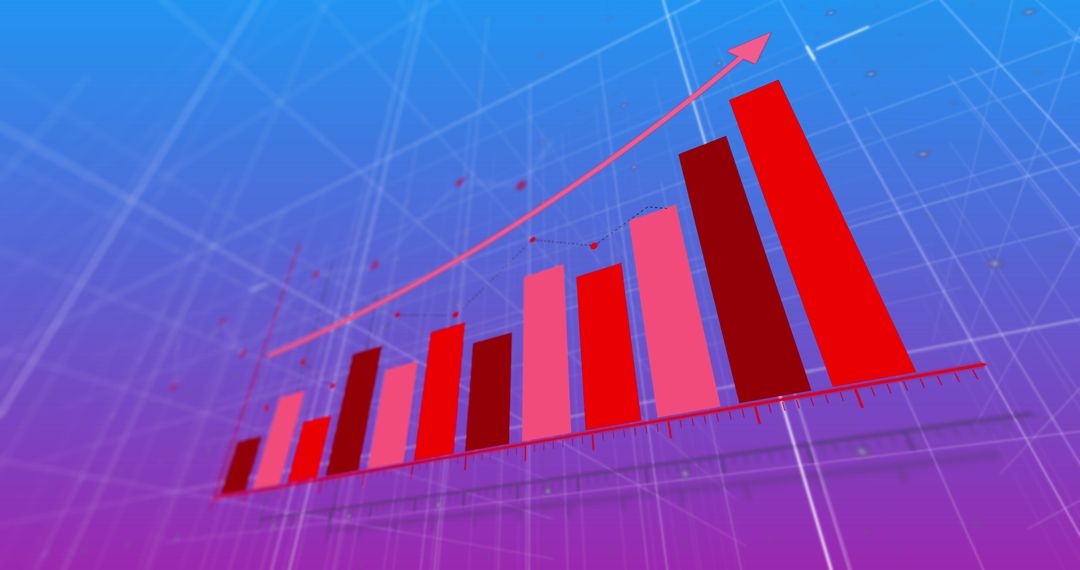
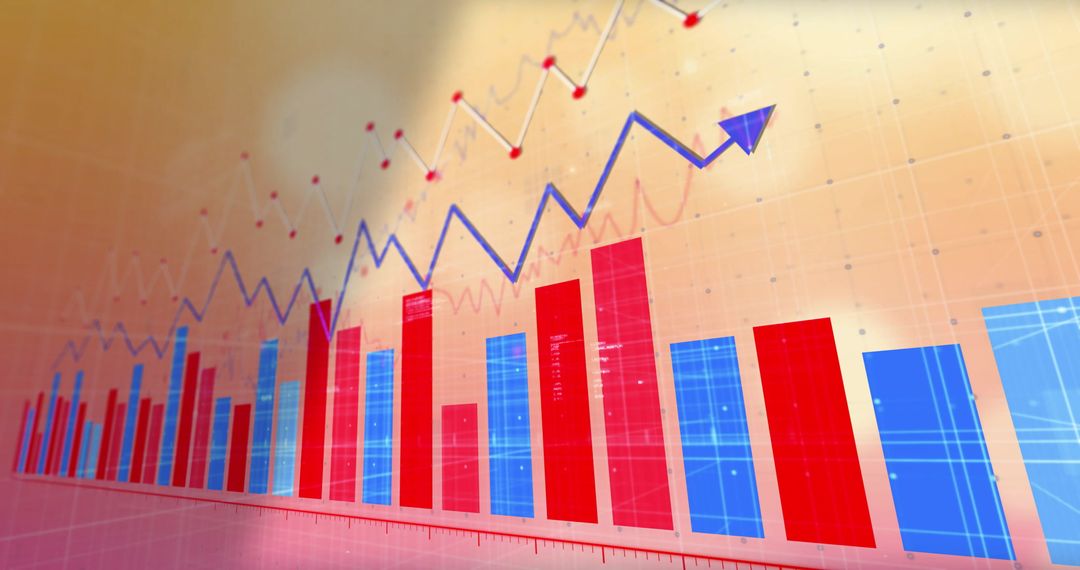
- Dynamic Financial Growth Chart on Vibrant Orange Background
Dynamic Financial Growth Chart on Vibrant Orange Background Image

Visual representation of financial data with a bar chart indicating growth, set against a bright, colorful orange backdrop. Ideal for illustrating themes related to business development, financial analytics, and economic forecasting. Useful for presentations, reports, and marketing materials highlighting market performance and future success projections.
Powered by  - Get 15% off with code: PIKWIZARD15


2
downloads
downloads
Tags:
More
Credit Photo
If you would like to credit the Photo, here are some ways you can do so
Text Link
photo Link
<span class="text-link">
<span>
<a target="_blank" href=https://pikwizard.com/photo/dynamic-financial-growth-chart-on-vibrant-orange-background/feed40c860bd2774663dc45d0e65224c/>PikWizard</a>
</span>
</span>
<span class="image-link">
<span
style="margin: 0 0 20px 0; display: inline-block; vertical-align: middle; width: 100%;"
>
<a
target="_blank"
href="https://pikwizard.com/photo/dynamic-financial-growth-chart-on-vibrant-orange-background/feed40c860bd2774663dc45d0e65224c/"
style="text-decoration: none; font-size: 10px; margin: 0;"
>
<img src="https://pikwizard.com/pw/medium/feed40c860bd2774663dc45d0e65224c.jpg" style="margin: 0; width: 100%;" alt="" />
<p style="font-size: 12px; margin: 0;">PikWizard</p>
</a>
</span>
</span>
Free (free of charge)
Free for personal and commercial use.
Author: People Creations
Similar Free Stock Images

Premium


Premium


Premium


Premium


Premium


Premium


Premium


Premium


Premium


Premium


Premium


Premium


Premium


Premium


Premium


Premium


Premium


Premium


Premium


Premium


Premium


Premium


Premium


Premium