- Home >
- Stock Photos >
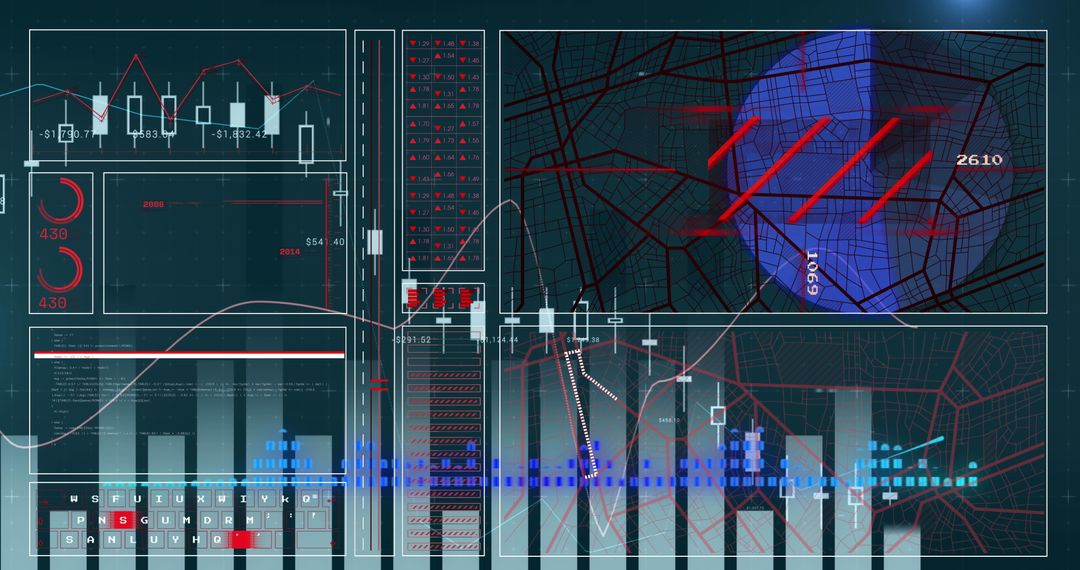
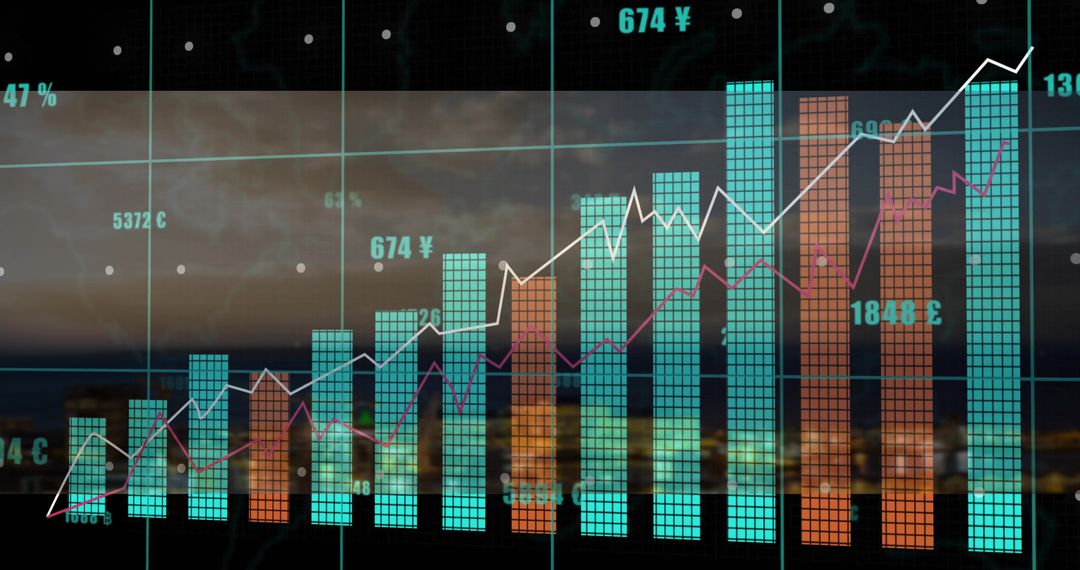
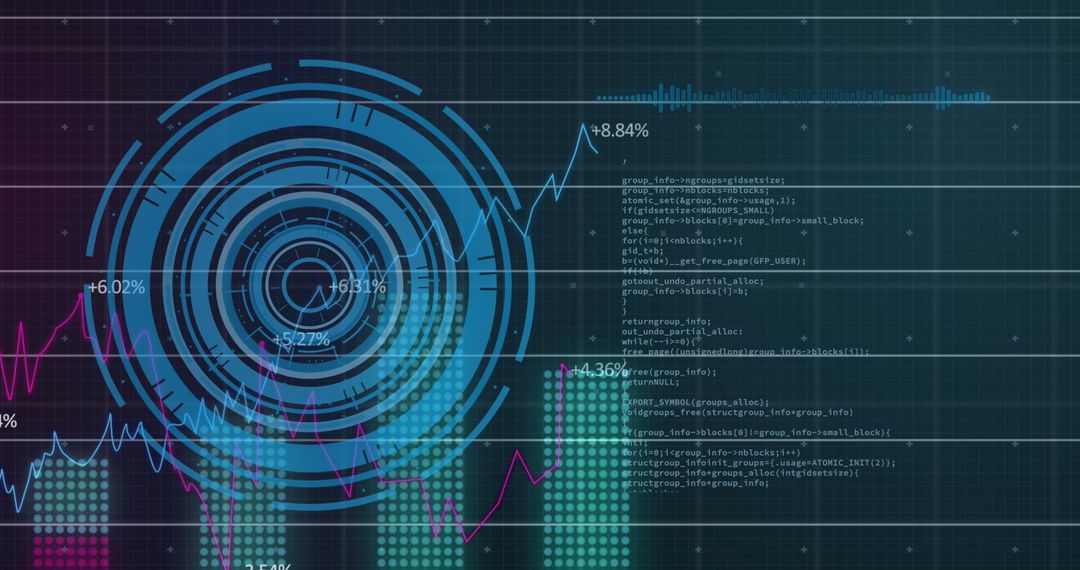
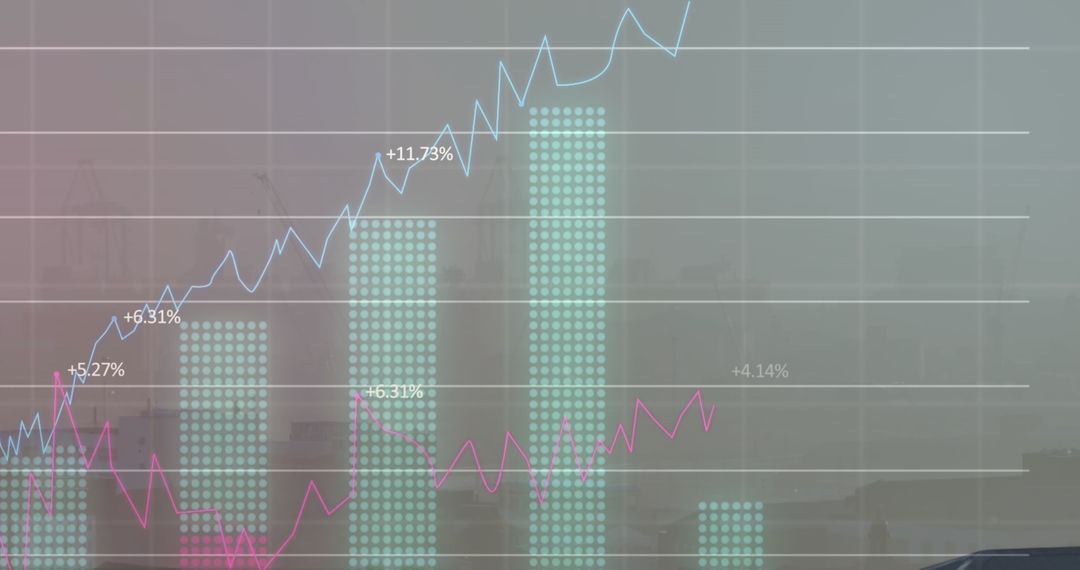
- Dynamic Financial Growth Chart with Digital Data Streams
Dynamic Financial Growth Chart with Digital Data Streams Image

This visualization depicts a futuristic financial graph with light trails suggesting digital data transmission. It includes various numerical values and bars, illustrating economic growth and trends in a digitally sophisticated style. Highly suitable for business presentations, financial services marketing, and technology-oriented content exploring stock market analysis and future financial projections.
Powered by 


2
downloads
downloads
Tags:
More
Credit Photo
If you would like to credit the Photo, here are some ways you can do so
Text Link
photo Link
<span class="text-link">
<span>
<a target="_blank" href=https://pikwizard.com/photo/dynamic-financial-growth-chart-with-digital-data-streams/79c8f0fe8e4c2724b46671b1ab983370/>PikWizard</a>
</span>
</span>
<span class="image-link">
<span
style="margin: 0 0 20px 0; display: inline-block; vertical-align: middle; width: 100%;"
>
<a
target="_blank"
href="https://pikwizard.com/photo/dynamic-financial-growth-chart-with-digital-data-streams/79c8f0fe8e4c2724b46671b1ab983370/"
style="text-decoration: none; font-size: 10px; margin: 0;"
>
<img src="https://pikwizard.com/pw/medium/79c8f0fe8e4c2724b46671b1ab983370.jpg" style="margin: 0; width: 100%;" alt="" />
<p style="font-size: 12px; margin: 0;">PikWizard</p>
</a>
</span>
</span>
Free (free of charge)
Free for personal and commercial use.
Author: Awesome Content
Similar Free Stock Images

Premium


Premium


Premium


Premium


Premium


Premium


Premium


Premium


Premium


Premium


Premium


Premium


Premium


Premium


Premium


Premium


Premium


Premium


Premium


Premium


Premium


Premium


Premium


Premium


Premium