- Home >
- Stock Photos >
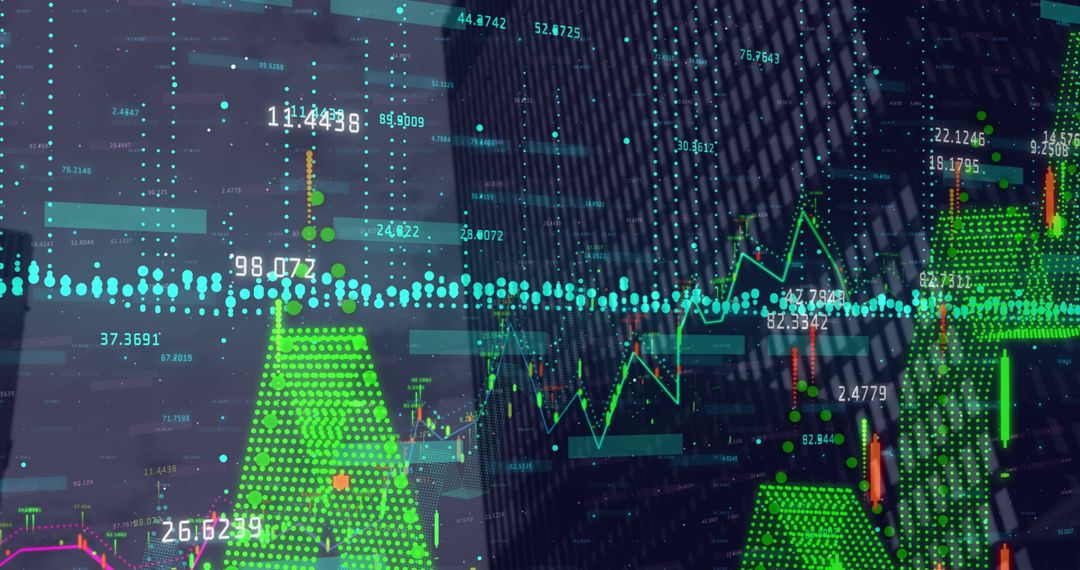
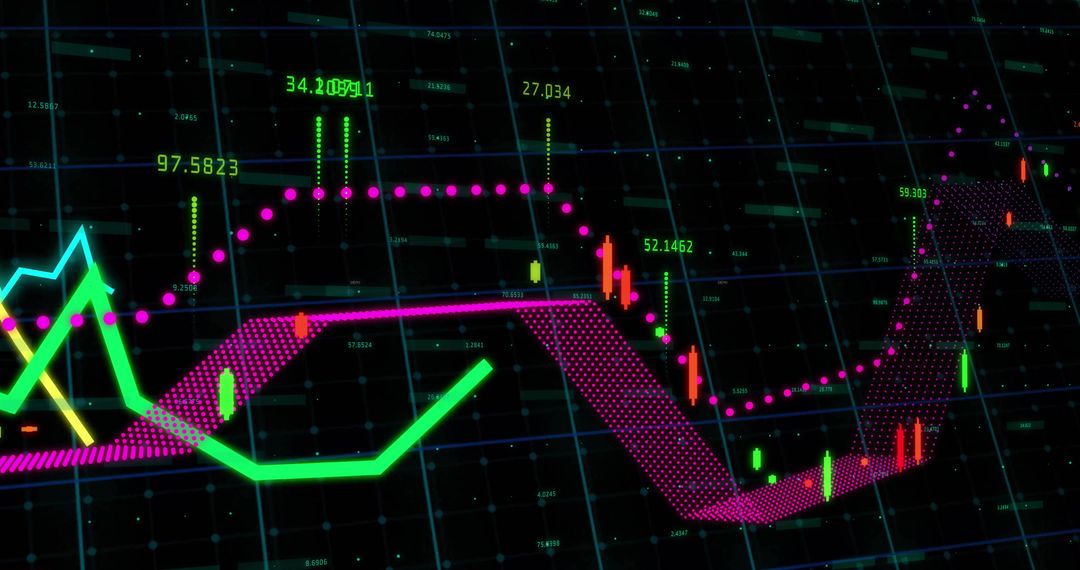
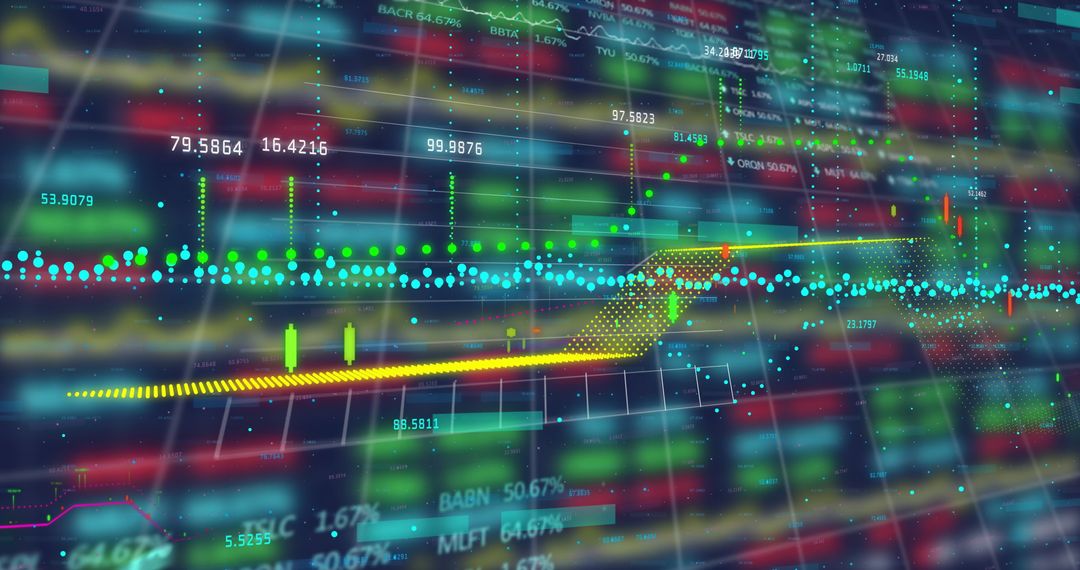
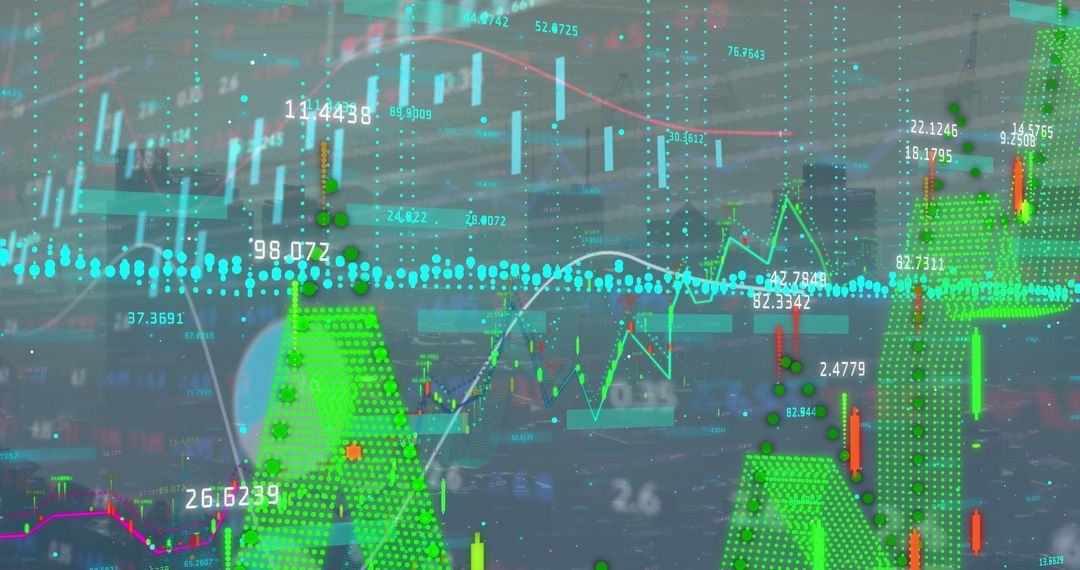
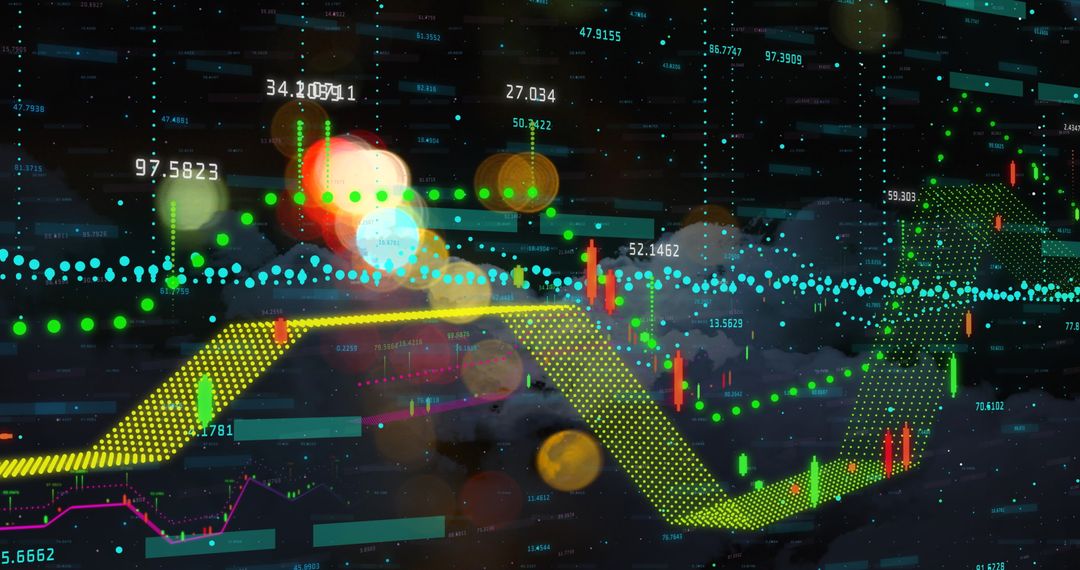
- Dynamic Financial Market Analysis with Candlestick Graphs
Dynamic Financial Market Analysis with Candlestick Graphs Image

Vibrant financial market visualization highlighting candlestick patterns, trend lines, and moving averages symbolizes a sophisticated approach to investment. Useful for illustrating financial concepts, marketing analytics platforms, or as a tutorial tool for stock market analysis.
Powered by 


0
downloads
downloads
Tags:
More
Credit Photo
If you would like to credit the Photo, here are some ways you can do so
Text Link
photo Link
<span class="text-link">
<span>
<a target="_blank" href=https://pikwizard.com/photo/dynamic-financial-market-analysis-with-candlestick-graphs/8de785f4a6db6ccbe83d89d42f788ae0/>PikWizard</a>
</span>
</span>
<span class="image-link">
<span
style="margin: 0 0 20px 0; display: inline-block; vertical-align: middle; width: 100%;"
>
<a
target="_blank"
href="https://pikwizard.com/photo/dynamic-financial-market-analysis-with-candlestick-graphs/8de785f4a6db6ccbe83d89d42f788ae0/"
style="text-decoration: none; font-size: 10px; margin: 0;"
>
<img src="https://pikwizard.com/pw/medium/8de785f4a6db6ccbe83d89d42f788ae0.jpg" style="margin: 0; width: 100%;" alt="" />
<p style="font-size: 12px; margin: 0;">PikWizard</p>
</a>
</span>
</span>
Free (free of charge)
Free for personal and commercial use.
Author: Awesome Content
Similar Free Stock Images
Premium


Premium


Premium


Premium


Premium


Premium


Premium


Premium


Premium


Premium


Premium


Premium


Premium


Premium


Premium


Premium


Premium


Premium


Premium


Premium


Premium


Premium


Premium


Premium