- Home >
- Stock Photos >
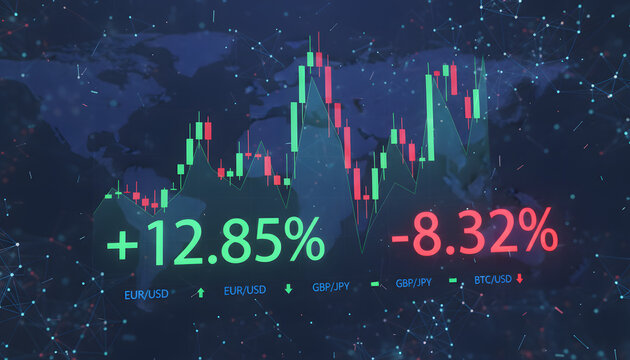
- Dynamic Forex Market Chart with Multiple Currencies and Growth Trends
Dynamic Forex Market Chart with Multiple Currencies and Growth Trends Image

Depiction of a fluctating forex market with visually appealing currency symbols and trend lines. Useful in illustrating concepts of financial growth, forex trading, banking industry, and economic reports. Ideal for digital presentations, educational materials, and macroeconomic analysis visuals.
Powered by 


2
downloads
downloads
Tags:
More
Credit Photo
If you would like to credit the Photo, here are some ways you can do so
Text Link
photo Link
<span class="text-link">
<span>
<a target="_blank" href=https://pikwizard.com/photo/dynamic-forex-market-chart-with-multiple-currencies-and-growth-trends/d0420695b05438fcfec2ff1497c11833/>PikWizard</a>
</span>
</span>
<span class="image-link">
<span
style="margin: 0 0 20px 0; display: inline-block; vertical-align: middle; width: 100%;"
>
<a
target="_blank"
href="https://pikwizard.com/photo/dynamic-forex-market-chart-with-multiple-currencies-and-growth-trends/d0420695b05438fcfec2ff1497c11833/"
style="text-decoration: none; font-size: 10px; margin: 0;"
>
<img src="https://pikwizard.com/pw/medium/d0420695b05438fcfec2ff1497c11833.jpg" style="margin: 0; width: 100%;" alt="" />
<p style="font-size: 12px; margin: 0;">PikWizard</p>
</a>
</span>
</span>
Free (free of charge)
Free for personal and commercial use.
Author: Awesome Content
Similar Free Stock Images

Premium


Premium


Premium


Premium


Premium


Premium


Premium


Premium


Premium


Premium


Premium


Premium


Premium


Premium


Premium


Premium


Premium


Premium


Premium


Premium


Premium


Premium


Premium


Premium