- Home >
- Stock Photos >
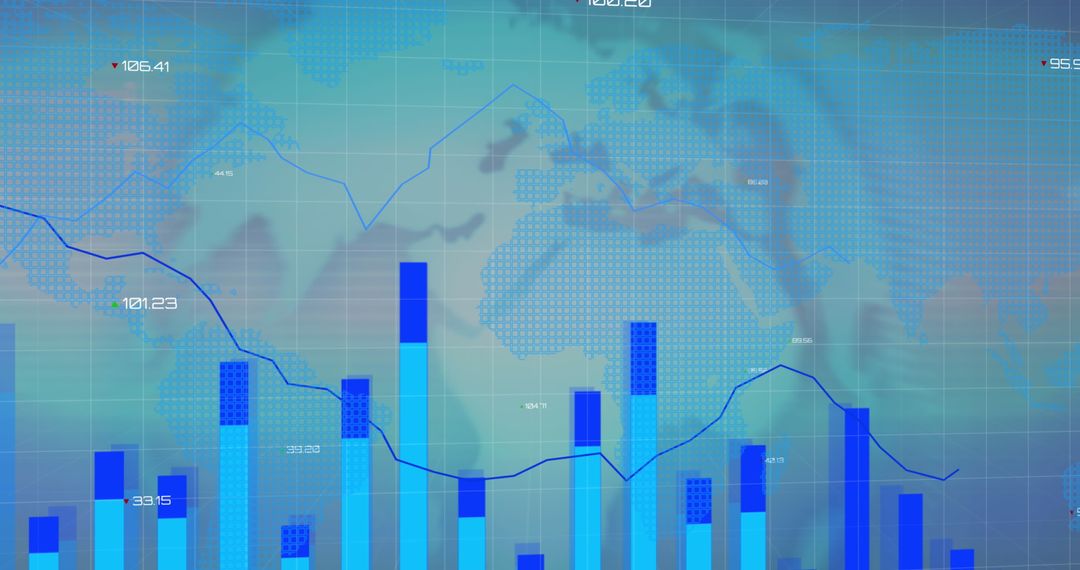
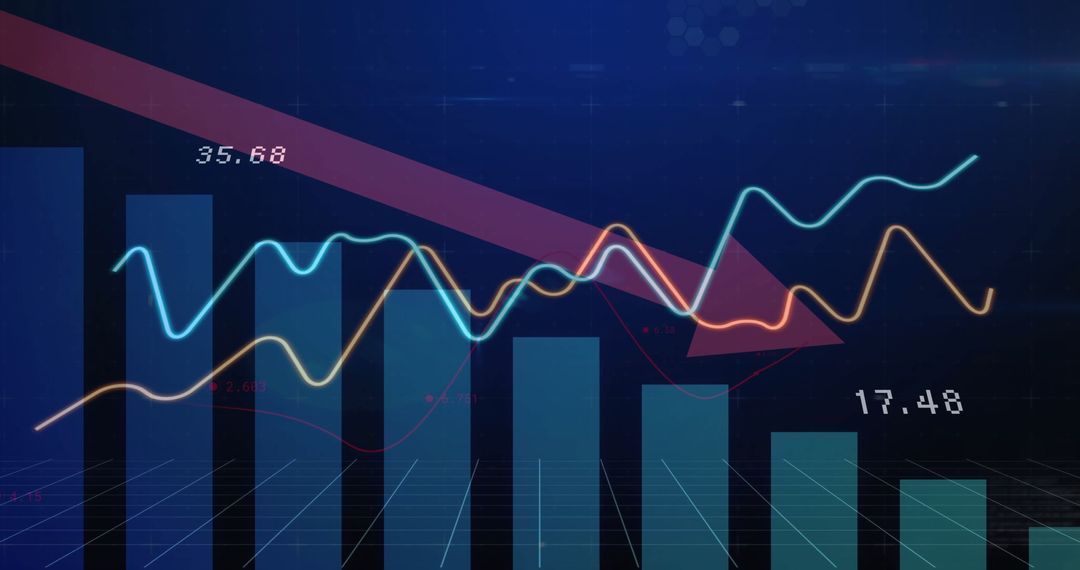
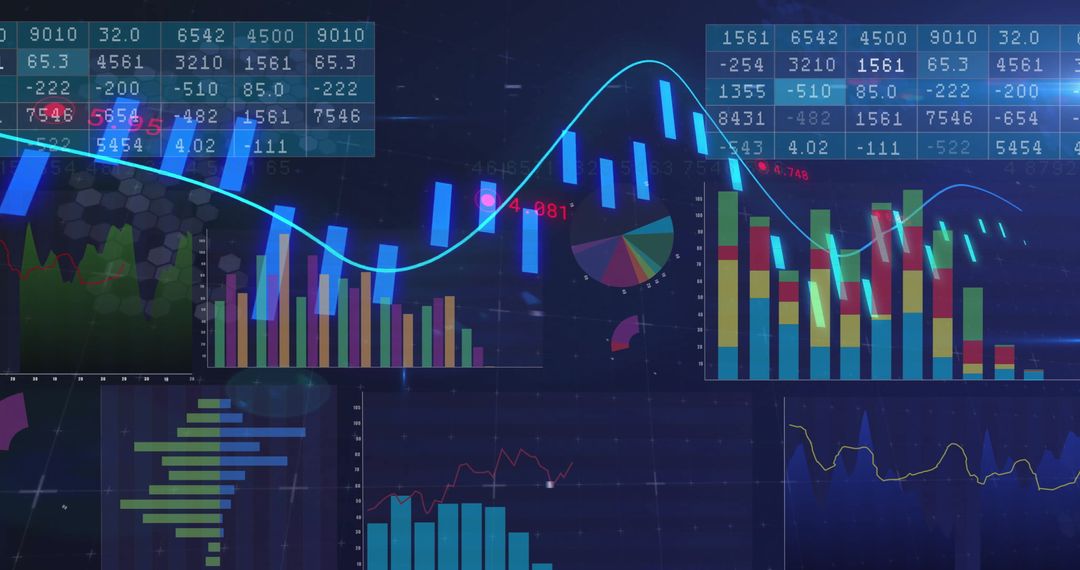
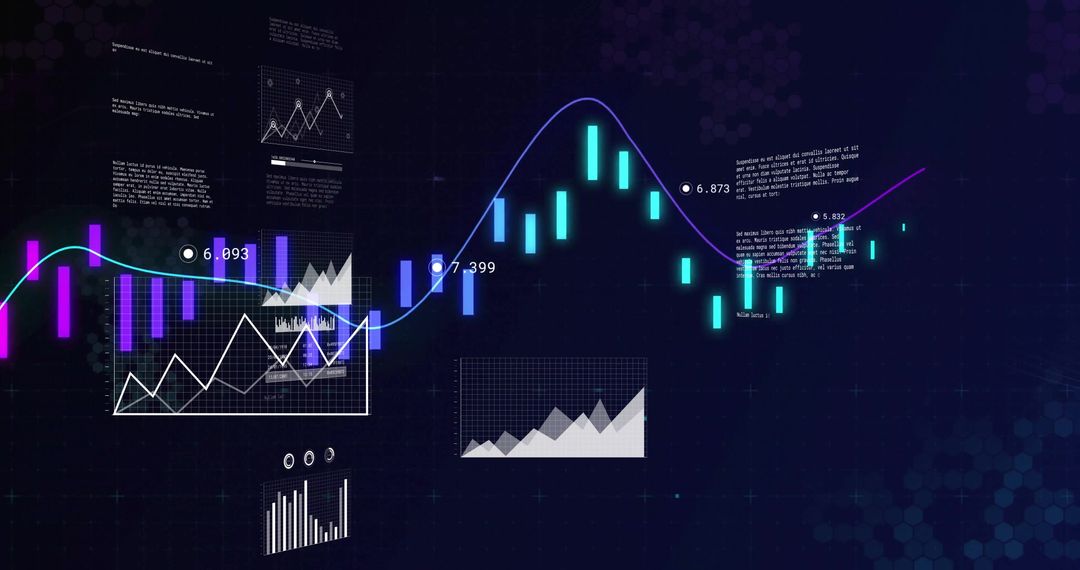
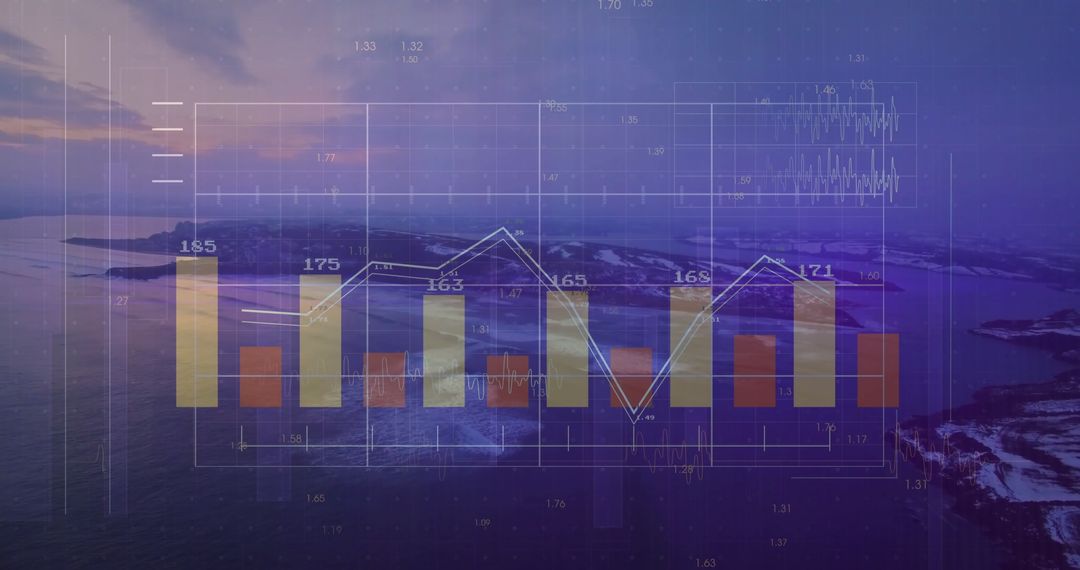
- Dynamic Global Finance Charts with Arrow in Blue Tone
Dynamic Global Finance Charts with Arrow in Blue Tone Image

Digital representation of finance concepts with various charts and diagnostic arrow on blue background illustrates business growth trends and statistical analysis. Ideal for presentations, reports, or educational materials related to global economy, financial analysis, and business strategy. Useful for designers and analysts preparing professional industry insights documents.
Powered by  - Get 15% off with code: PIKWIZARD15


2
downloads
downloads
Tags:
More
Credit Photo
If you would like to credit the Photo, here are some ways you can do so
Text Link
photo Link
<span class="text-link">
<span>
<a target="_blank" href=https://pikwizard.com/photo/dynamic-global-finance-charts-with-arrow-in-blue-tone/49f84e29b55d53ebf260cb1885839910/>PikWizard</a>
</span>
</span>
<span class="image-link">
<span
style="margin: 0 0 20px 0; display: inline-block; vertical-align: middle; width: 100%;"
>
<a
target="_blank"
href="https://pikwizard.com/photo/dynamic-global-finance-charts-with-arrow-in-blue-tone/49f84e29b55d53ebf260cb1885839910/"
style="text-decoration: none; font-size: 10px; margin: 0;"
>
<img src="https://pikwizard.com/pw/medium/49f84e29b55d53ebf260cb1885839910.jpg" style="margin: 0; width: 100%;" alt="" />
<p style="font-size: 12px; margin: 0;">PikWizard</p>
</a>
</span>
</span>
Free (free of charge)
Free for personal and commercial use.
Author: Authentic Images
Similar Free Stock Images

Premium


Premium


Premium


Premium


Premium


Premium


Premium


Premium


Premium


Premium


Premium


Premium


Premium


Premium


Premium


Premium


Premium


Premium


Premium


Premium


Premium


Premium


Premium


Premium