1. Home > 
  2. Stock Photos > 
  3. Dynamic Graphs and Diagrams on Colorful Background Highlighting Trend Data

Dynamic Graphs and Diagrams on Colorful Background Highlighting Trend Data Image

Dynamic Graphs and Diagrams on Colorful Background Highlighting Trend Data

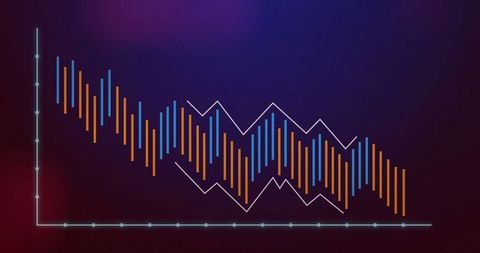
Bright graphs with digital effects layered over colorful gradients display complex business data analysis. Perfect for illustrating technological advancements in presentations, articles on data trends, or digital interface designs. Eye-catching elements merge business intelligence with engaging visuals to enhance understanding of statistical information.

Powered by Shutterstock logo - Get 15% off with code: PIKWIZARD15
Data science and big data technology. Scientist computing, analysing and visualizing complex data set on computer. Data mining, artificial intelligence, machine learning, business analytics. - Powered by Shutterstock - Get 15% off with code: PIKWIZARD15Data analytics and insights powered by big data and artificial intelligence technologies. Data scientist working with complex information analysed by AI for business analytics dashboard with charts. - Powered by Shutterstock - Get 15% off with code: PIKWIZARD153D Graphics Concept: Big Data Center Female Chief Technology Officer Using Laptop Standing In Warehouse, Activates Servers, Information Digitalization Starts. SAAS, Cloud Computing, Web Service - Powered by Shutterstock - Get 15% off with code: PIKWIZARD15Analyst working with Business, Concept digital transformation technology strategy, Analytics and Data Management System on computer, make a report with KPI and metrics connected to database. - Powered by Shutterstock - Get 15% off with code: PIKWIZARD15Businessman using laptop computer analyzing sales data and financial growth graph chart report. Business planning, strategy and development. Financial accounting. market research, data analysis - Powered by Shutterstock - Get 15% off with code: PIKWIZARD15

Credit Photo

If you would like to credit the Photo, here are some ways you can do so

Free (free of charge)

Free for personal and commercial use.

Author: Creative Art

Similar Free Stock Images

Abstract Financial Chart Technology Interface
Premium
AI, Big Data, and business analytics icons represent the integration of advanced technology in analyzing graphs, business data, and market trends, driving strategic decisions and innovative solutions.
Digital Charts and Financial Data Background in Blue Tones
Dynamic Stock Market Data on Black Background
Financial Data Visualization on Blue Background
Abstract Financial Data Analysis on Black Background
Premium
Big data technology and data science. Data scientist querying, analysing and visualizing complex set on virtual screen. Data flow concept. Neural network, artificial intelligence, ML, analytics.
Dynamic Financial Data Elements on Abstarct Grid
Abstract Digital Financial Chart on Blue Interface
Dynamic Data Visualization on Digital Interface
Colorful Digital Waveform Represents Global Connections
Premium
Scientist working with business data, finance, marketing report, Big Data Analytics technology, Processing Complexity information flow on virtual screen, machine learning, artificial intelligence, ML
Colorful Bar Graph on Dark Background Illustrates Data Trends
Futuristic Financial Graph on Purple Retro Background
Rising Financial Market Trends with Data Visualization
Colorful Data Chart Over Blue Background
Premium
Analysts use computers to analyze statistical data to improve targeted digital online marketing strategies for a business advantage. Data Science Software Developer.
Futuristic Stock Market Graph With Digital Overlay
Stagflation Concept with Digital Graphs and Data Patterns
Abstract Financial Data with Dynamic Graphs on Blue Background
Global Business Dashboard Overlay on Urban Skyline Background
Premium
Abstract wave shape on a low-polygonal triangular background for design on the topic of cyberspace, big data, metaverse, network security, data transfer on dark blue abstract cyberspace background.
Animated Financial Data with Heartbeat Overlapping Lines
Dynamic Forex Market Chart with Multiple Currencies and Growth Trends
Financial Data Displayed with Trends on Blue Background
Financial Data Analysis with Interactive Graphs
Premium
Big data analysis with AI technology. Person using machine learning and deep learning neural network for data science, data mining, business analytics, automation, data engineering. Glowing particles.
Dynamic Financial Data Visualization with Binary Code Overlay
Fluctuating Financial Graph on Digital Orange Background
Financial Data Display with Dynamic Digital Graph
Digital Data Visualization with Graph Over Red Background
Dynamic Financial Data Visualization with Blue Trends
Abstract Digital Financial Chart on Blue Background
Premium
Big data analytics with AI technology. Data analyst analyzing and visualizing complex information network with artificial intelligence. Machine learning algorithm for business analytics and finance.
Dynamic Financial Data Display with Market Trends
Financial Data Analyzing with Blue Digital Interface Background
Financial Data Processing Visualization with Colorful Bar Charts
Financial Data Analysis with Dynamic Graph on Blue Background
Premium
Man look at the dashboard with graphs and charts. Concept of data management system, business intelligence, data statistics, marketing analysis, key performance indicators (KPI) and analytics.
Futuristic Digital Data Analysis Visual with Line Graphs
Abstract Colorful Bar Graph on Red Background
Abstract Sound Waves on Dark Background
Fluctuating Financial Graph with Red Line on Green Grid
Premium
business analytics and financial technology concept, 3d chart from the screen of digital tablet computer
Dynamic Line Chart with Histogram on Digital Grid Background
Dynamic Financial Graphs Illustrating Market Trends
Dynamic Financial Growth Representing Business Trends
Vibrant Digital Stock Market Graph Showing Financial Data Trends
Premium
Analyzing Key Performance Indicators. Businessman using digital screen to analyze key performance indicators (KPI) with various graphs and charts, showcasing data analysis and performance tracking.
Abstract Digital Interface with Network Connections and Data Visualizations
Dynamic Colorful Wave Pattern on Dark Background
Dynamic Digital Soundwave Pattern on Dark Background
Abstract Data Visualization with Dynamic Charts and Graphs
Premium
Smart city and abstract polygon pattern connection with speed line light, big data connection technology concept .
Data Analysis Graphics on Digital Grid Background
Financial Data Analysis on Blue Digital Interface
Upward Stock Market Arrow with Binary Code Background
Futuristic Digital Interface with Data Graphs
Premium
Muslim businessman working with floating data visualization screen
Abstract Digital Data Graph and Diagrams on Gray Background
Dynamic Financial Data Analysis with Graph Overlays
Colorful Waveforms on Blue Background
Complex Financial Data Analysis on Purple Grid Background
Abstract Financial Stock Market Graph Overlay on Digital Interface
Dynamic Financial Data Analytics Interface with Blue Background
Premium
A hand interacts with holographic data visuals above a laptop, showcasing modern technology and data analysis.
Financial Chart Analysis with Digital Grid Interface
Vibrant Financial Data Analysis on Black Background
Dynamic Financial Graphs Over Cityscape Background
Digital Financial Graph with Dynamic Trading Analysis
Premium
AI, Big Data, and business analytics icons represent the integration of advanced technology in analyzing graphs, business data, and market trends, driving strategic decisions and innovative solutions.
Digital Data Visualization in Abstract Design
Economic and Political Factors Influence Investment Trends
Dynamic Financial Graph on Dark Red Background
Abstract Financial Graph with Bar and Line Charts on Dark Background
Premium
Backview Of Caucasian Woman Looking at Animated Stream Of Online Interfaces With Social Media, Fintech Services, e-Commerce Shopping, Internet Influencers And Video Games. Visualization Of Web Network
Futuristic Stock Market Data Visualization with Graphs
Fluctuating Digital Stock Market Data Chart
Dynamic Financial Stock Market Data Chart Visualization
Dynamic Stock Market Data on Digital Interface
Premium
Man look at the dashboard with graphs and charts. Concept of data management system, business intelligence, data statistics, marketing analysis, key performance indicators (KPI) and analytics.
Abstract Digital Financial Data Chart with Pink Line Oscillations
Financial Data Processing with Rising Graphs
Colorful Bar Graph with Data Overlay on Black Background
Dynamic Bar Graph Display of Financial Data Trends
Premium
Big data technology and data science. Data scientist querying, analysing and visualizing complex information on virtual screen. Data flow concept. Business analytics, finance, neural network, AI, ML.
Global Business Finance Data Analysis Visualization
Abstract Financial Data Charts Reflecting Economic Trends
Dynamic Data Graphs Display on Dark Digital Background
Abstract Data Visualization Digital Chart Background
Premium
Data science and big data technology. Engineer computing, analysing and visualizing complex data stream on computer. Data mining, artificial intelligence, machine learning, business analytics.
Fluctuating Stock Market Graph with Dramatic Peaks
Dynamic Financial Data Visualization with Abstract Graph
Digital Financial Data Representation with Abstract Graph
Abstract Financial Data Technology Background
Dynamic Digital Financial Data Interface Background
Dynamic Stock Market Chart Showing Fluctuating Financial Data
Premium
Smart city and intelligent communication network of things ,wireless connection technologies concept
Dynamic Financial Data Graph on Blue Digital Background
Dynamic Financial Data Visualization over Urban Silhouette
Global Financial Data Analysis with World Map Visualization
Abstract Data Graph Infographic on Purple Gradient Background
Premium
Big data technology and data science with person touching data flowing on virtual screen. Business analytics, artificial intelligence, machine learning. Engineer or scientist analyzing stream of data.
Financial Data Overlay on Estonian Flag Background
Abstract Financial Graph on Dark Digital Background
Abstract Financial Graph Illustration on Dark Background
Falling Line Graph on Navy Background Illustrating Economic Decline
Premium
Dashboard finance management on laptop computer analyzing sales data and growth graph chart report. Business planning, strategy and development. Financial accounting. market research, data analysis
Abstract Neon Waves on Dark Background Concept
Financial Data Line Graph on Digital Display
Data Security with Tech Bar Graph Overlay
Dynamic Data Visualization and Financial Growth Curves
Premium
Professional data analyst using data visualizations dashboard on computer monitor for data business analysis and Data Management System
Digital Analysis of Financial Data with Dynamic Graphs
Abstract Financial Data Visualization with Graphs
Digital Data Visualizations With Green Graphs and Bars
Colorful Financial Graph with Digital Technology Concept
Premium
Analyst working with Business Analytics and Data Management System on computer to make report with KPI and metrics connected to database. Corporate strategy for finance, operations, sales, marketing
Glowing Financial Graph with World Map in Dark Background
Dynamic Line Graph with Fluctuating Data on Red Background
Digital Data Processing Chart and Interface on Pink Background
Abstract Data Graph with Dynamic Charts and Indicators
Premium
Digital technology, big data, internet network connection, futuristic innovation technology background. Man using mobile phone and laptop and smart city
Dynamic Stock Market Graph with Fluctuating Data Bars