- Home >
- Stock Photos >
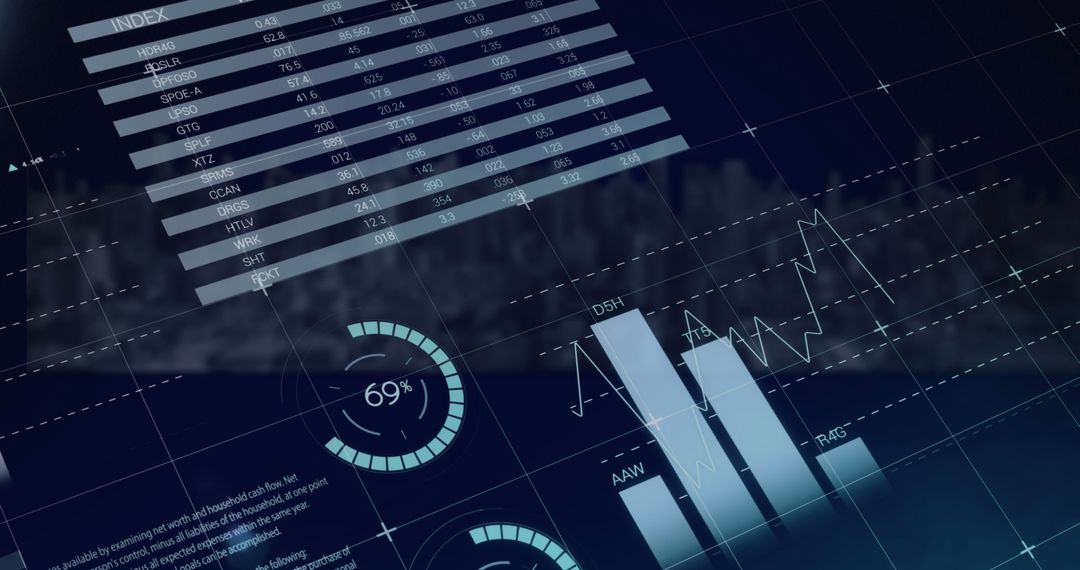
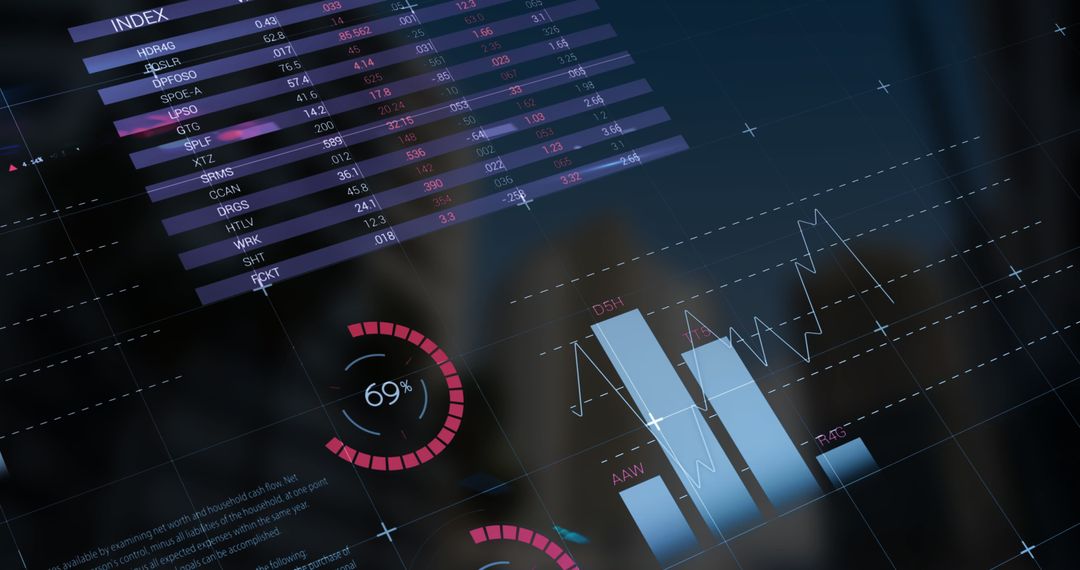
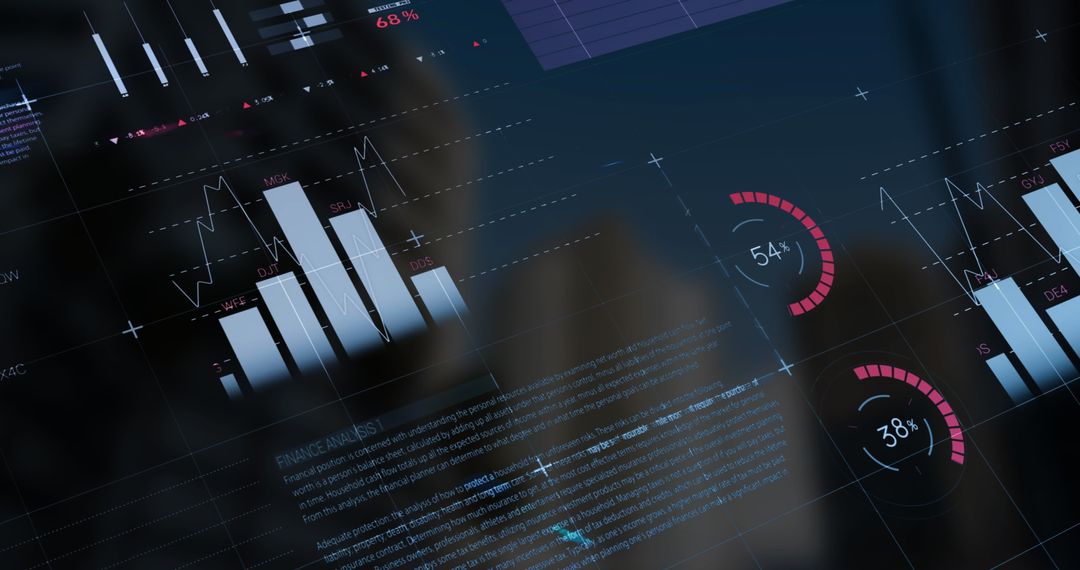
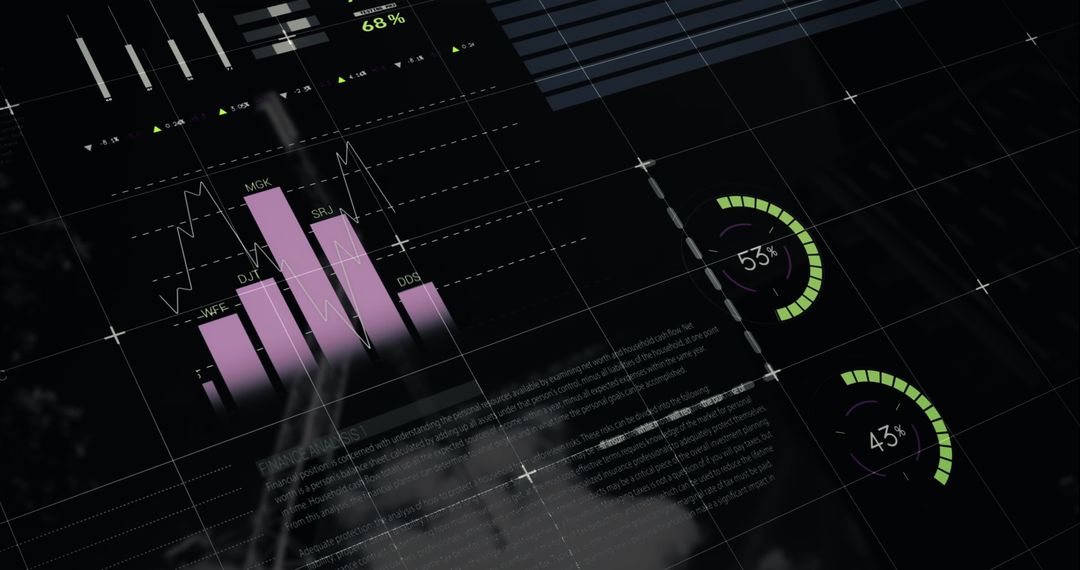
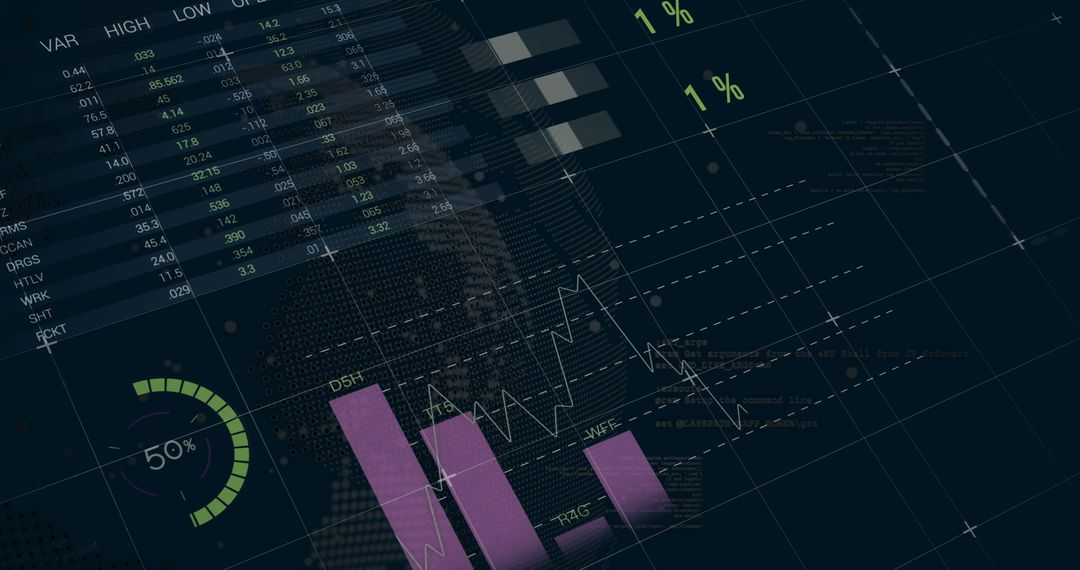
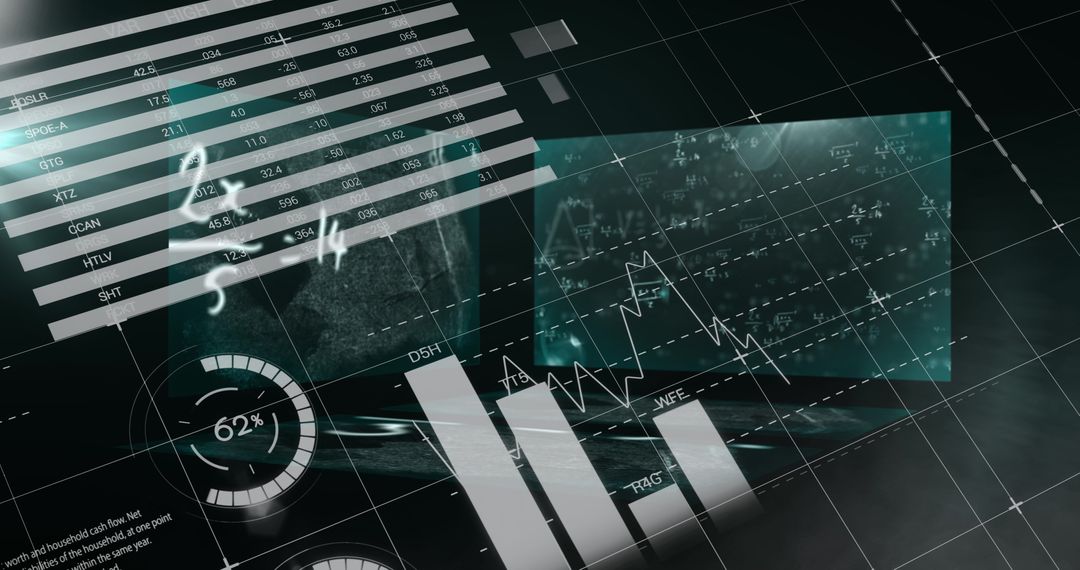
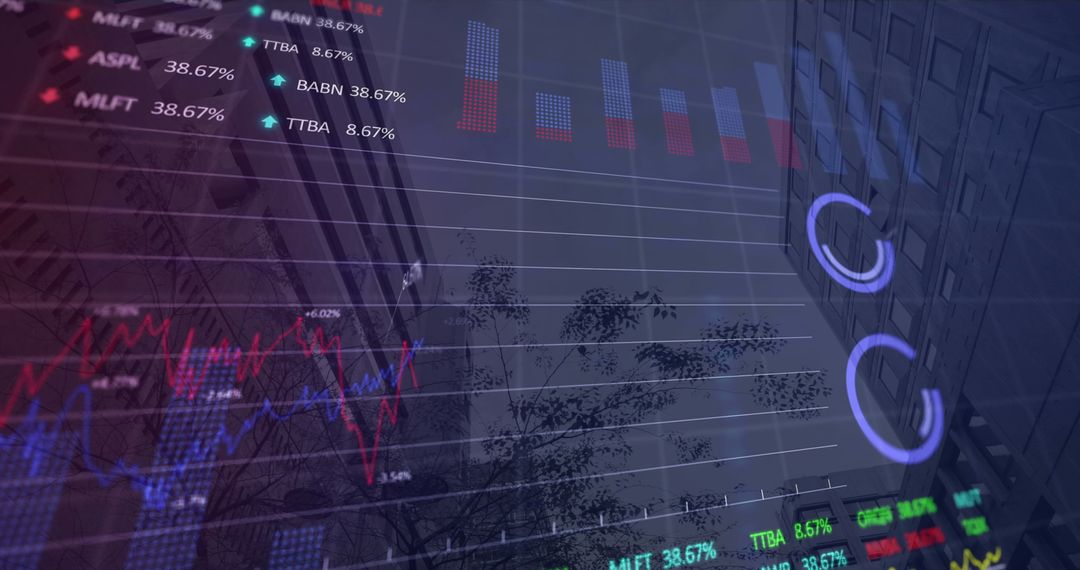
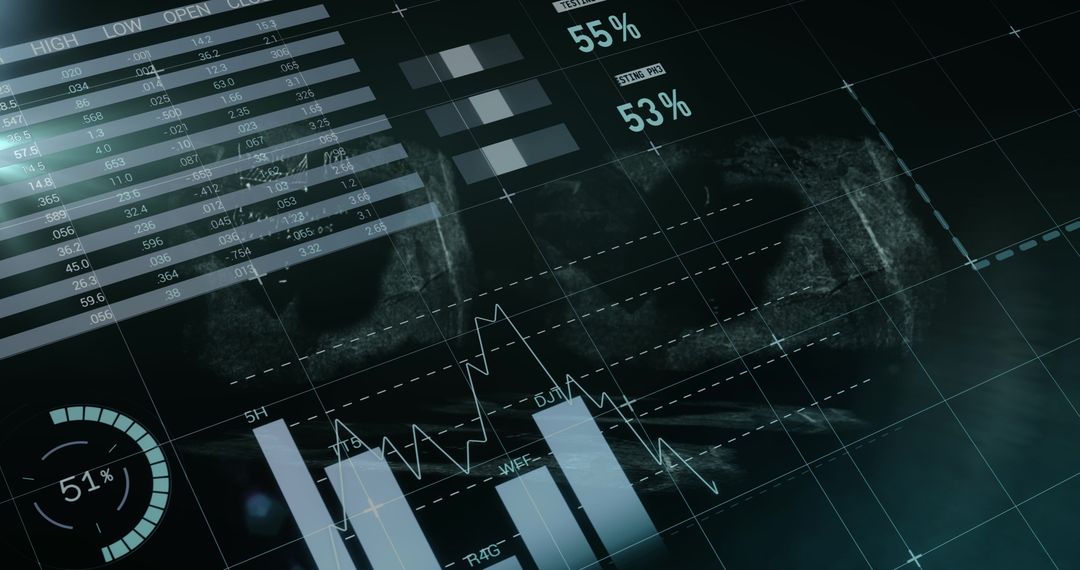
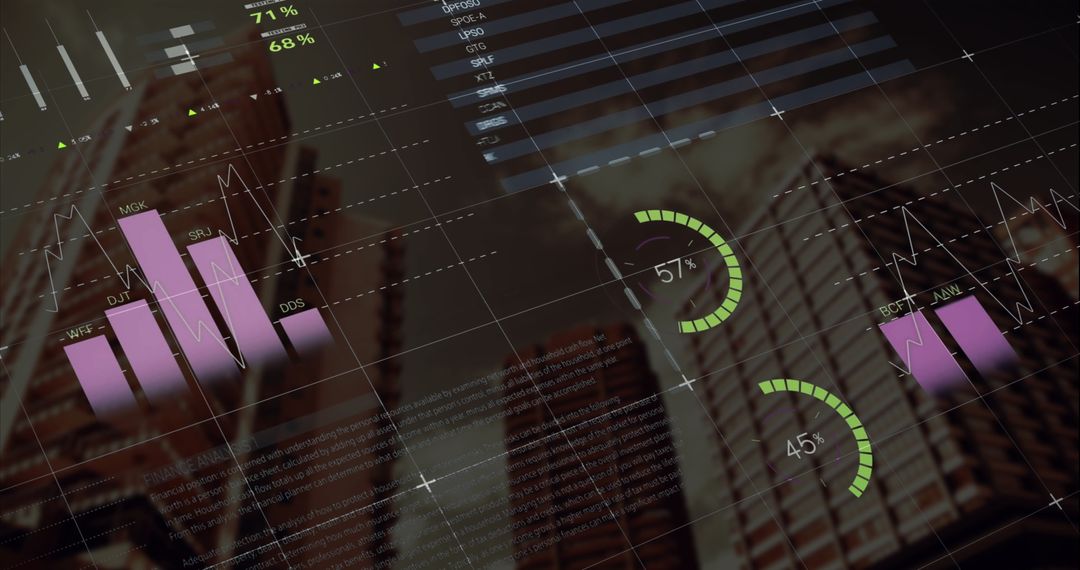
- Dynamic Holographic Financial Dashboard with Graphs and Charts
Dynamic Holographic Financial Dashboard with Graphs and Charts Image

This futuristic financial dashboard is featuring animated graphs and charts, ideal for illustrating concepts in technology, finance, and data analytics. Its holographic appearance conveys modern digital solutions, making it suited for use in presentations, reports, or educational materials on topics like stock market analysis, business stats review, or financial tech advancements.
Powered by 


2
downloads
downloads
Tags:
More
Credit Photo
If you would like to credit the Photo, here are some ways you can do so
Text Link
photo Link
<span class="text-link">
<span>
<a target="_blank" href=https://pikwizard.com/photo/dynamic-holographic-financial-dashboard-with-graphs-and-charts/c86a4f31c4eb3b4f743b69d949f6e45e/>PikWizard</a>
</span>
</span>
<span class="image-link">
<span
style="margin: 0 0 20px 0; display: inline-block; vertical-align: middle; width: 100%;"
>
<a
target="_blank"
href="https://pikwizard.com/photo/dynamic-holographic-financial-dashboard-with-graphs-and-charts/c86a4f31c4eb3b4f743b69d949f6e45e/"
style="text-decoration: none; font-size: 10px; margin: 0;"
>
<img src="https://pikwizard.com/pw/medium/c86a4f31c4eb3b4f743b69d949f6e45e.jpg" style="margin: 0; width: 100%;" alt="" />
<p style="font-size: 12px; margin: 0;">PikWizard</p>
</a>
</span>
</span>
Free (free of charge)
Free for personal and commercial use.
Author: Awesome Content
Similar Free Stock Images

Premium


Premium


Premium


Premium


Premium


Premium


Premium


Premium


Premium


Premium


Premium


Premium


Premium


Premium


Premium


Premium


Premium


Premium


Premium


Premium


Premium


Premium


Premium


Premium