- Home >
- Stock Photos >
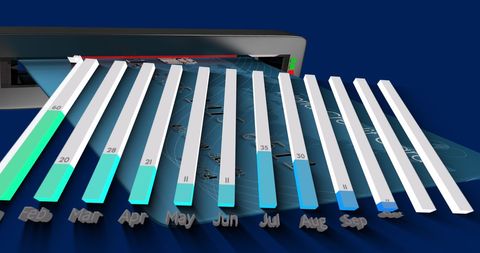
- Dynamic Infographic Highlighting Monthly Data Trends with Activity Icons
Dynamic Infographic Highlighting Monthly Data Trends with Activity Icons Image

Visual showing monthly data trends with icons for various activities offers a clear snapshot of changes. Ideal for reports, presentations, and data analysis resources, providing quick insights into monthly developments and patterns critical for decision-makers.
Powered by  - Get 15% off with code: PIKWIZARD15


2
downloads
downloads
Tags:
More
Credit Photo
If you would like to credit the Photo, here are some ways you can do so
Text Link
photo Link
<span class="text-link">
<span>
<a target="_blank" href=https://pikwizard.com/photo/dynamic-infographic-highlighting-monthly-data-trends-with-activity-icons/c9425837c86d5a58bf74c343a6d05b4d/>PikWizard</a>
</span>
</span>
<span class="image-link">
<span
style="margin: 0 0 20px 0; display: inline-block; vertical-align: middle; width: 100%;"
>
<a
target="_blank"
href="https://pikwizard.com/photo/dynamic-infographic-highlighting-monthly-data-trends-with-activity-icons/c9425837c86d5a58bf74c343a6d05b4d/"
style="text-decoration: none; font-size: 10px; margin: 0;"
>
<img src="https://pikwizard.com/pw/medium/c9425837c86d5a58bf74c343a6d05b4d.jpg" style="margin: 0; width: 100%;" alt="" />
<p style="font-size: 12px; margin: 0;">PikWizard</p>
</a>
</span>
</span>
Free (free of charge)
Free for personal and commercial use.
Author: Authentic Images
Similar Free Stock Images

Premium


Premium


Premium


Premium


Premium


Premium


Premium


Premium


Premium


Premium


Premium


Premium


Premium


Premium


Premium


Premium


Premium


Premium


Premium


Premium


Premium


Premium


Premium


Premium


Premium