
- Home >
- Stock Photos >
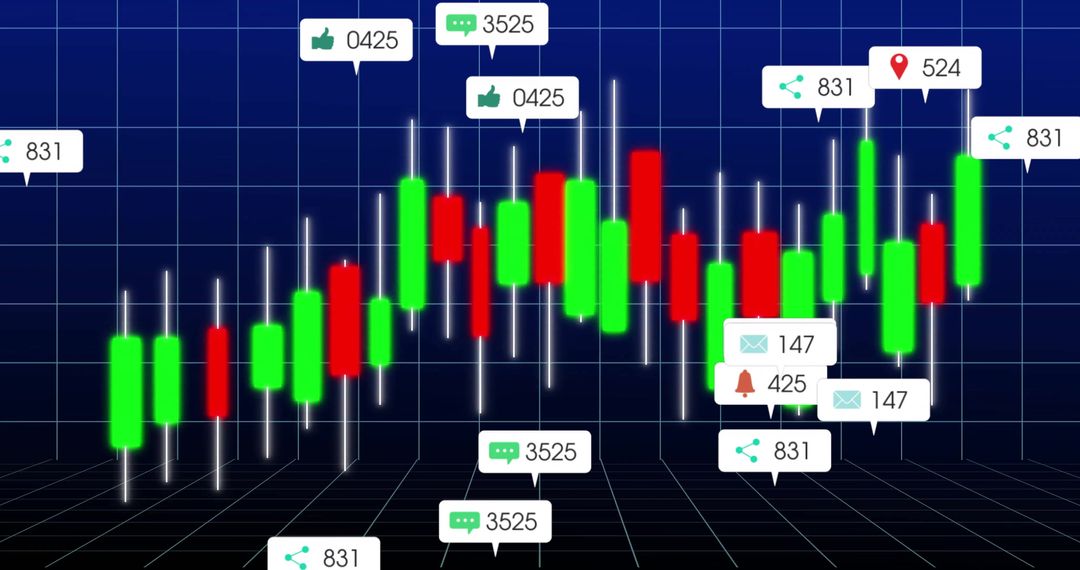
- Dynamic Line Graph on Green Dashboard with Analytics Icons
Dynamic Line Graph on Green Dashboard with Analytics Icons Image

Illustrates a red zigzag line graph over a green grid background, featuring icons for magnifier, user, and envelope. Represents analytics and performance metrics within a corporate digital dashboard. Suitable for business presentations, digital marketing materials, and educational content focused on data analysis.
Powered by  - Get 15% off with code: PIKWIZARD15


0
downloads
downloads
Tags:
More
Credit Photo
If you would like to credit the Photo, here are some ways you can do so
Text Link
photo Link
<span class="text-link">
<span>
<a target="_blank" href=https://pikwizard.com/photo/dynamic-line-graph-on-green-dashboard-with-analytics-icons/bbb027944e2950d66b8e3bd503cc214f/>PikWizard</a>
</span>
</span>
<span class="image-link">
<span
style="margin: 0 0 20px 0; display: inline-block; vertical-align: middle; width: 100%;"
>
<a
target="_blank"
href="https://pikwizard.com/photo/dynamic-line-graph-on-green-dashboard-with-analytics-icons/bbb027944e2950d66b8e3bd503cc214f/"
style="text-decoration: none; font-size: 10px; margin: 0;"
>
<img src="https://pikwizard.com/pw/medium/bbb027944e2950d66b8e3bd503cc214f.jpg" style="margin: 0; width: 100%;" alt="" />
<p style="font-size: 12px; margin: 0;">PikWizard</p>
</a>
</span>
</span>
Free (free of charge)
Free for personal and commercial use.
Author: Creative Art
Similar Free Stock Images

Premium


Premium


Premium


Premium


Premium


Premium


Premium


Premium


Premium


Premium


Premium


Premium


Premium


Premium


Premium


Premium


Premium


Premium


Premium


Premium


Premium


Premium


Premium


Premium

