
- Home >
- Stock Photos >
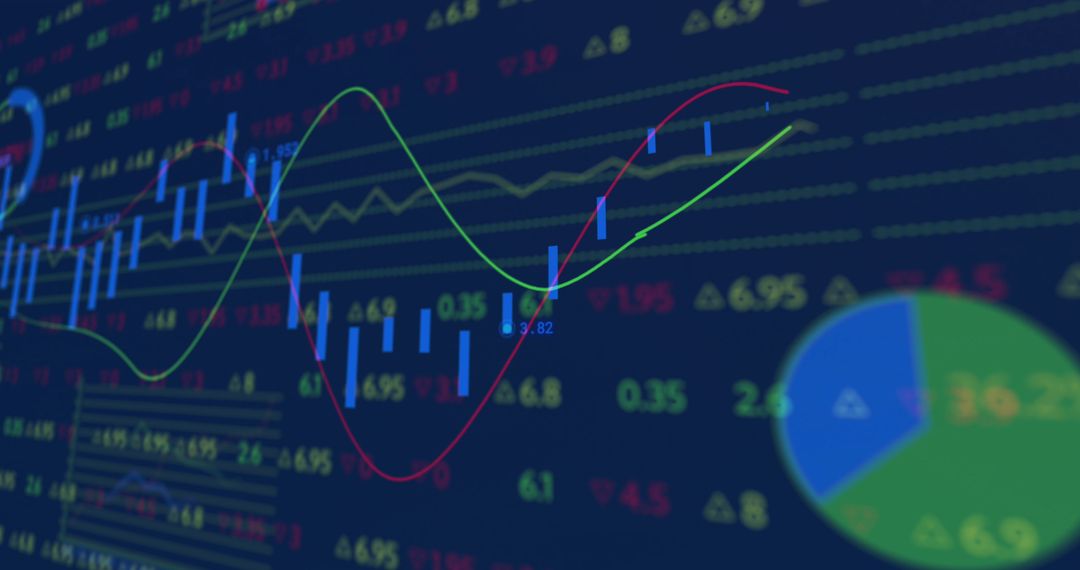
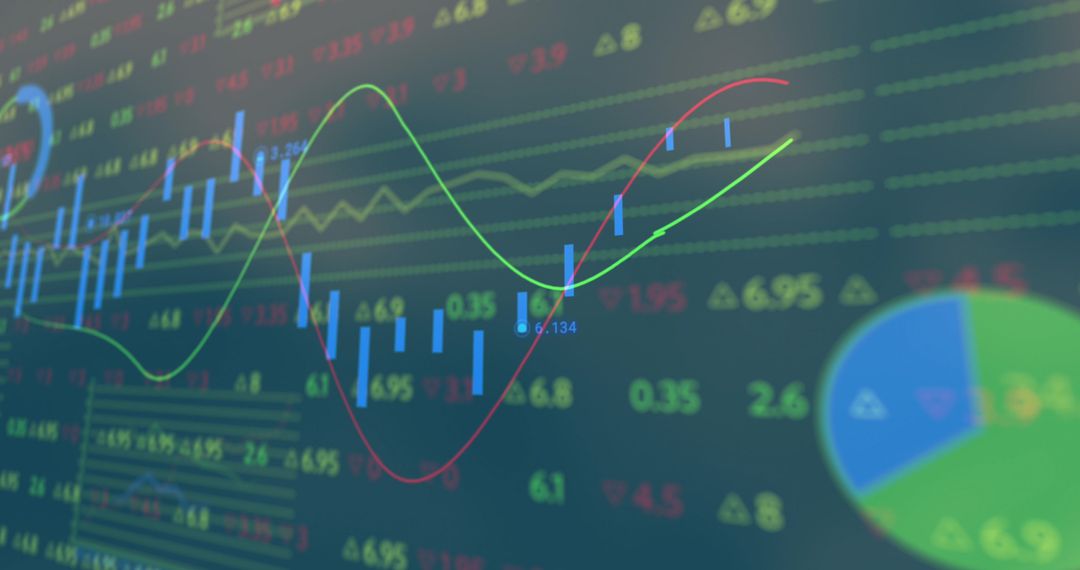
- Dynamic Stock Market Analysis Numbers and Graphs
Dynamic Stock Market Analysis Numbers and Graphs Image

Image depicts dynamic stock market numbers and graphs in dark background, representing the complexity of financial transactions and data processing. Useful for illustrating topics in finance, investment analysis, economics studies, or business-related technological concepts.
Powered by  - Get 15% off with code: PIKWIZARD15


2
downloads
downloads
Tags:
More
Credit Photo
If you would like to credit the Photo, here are some ways you can do so
Text Link
photo Link
<span class="text-link">
<span>
<a target="_blank" href=https://pikwizard.com/photo/dynamic-stock-market-analysis-numbers-and-graphs/e004cd6dbaea6aa974e5c64b8d2a0c53/>PikWizard</a>
</span>
</span>
<span class="image-link">
<span
style="margin: 0 0 20px 0; display: inline-block; vertical-align: middle; width: 100%;"
>
<a
target="_blank"
href="https://pikwizard.com/photo/dynamic-stock-market-analysis-numbers-and-graphs/e004cd6dbaea6aa974e5c64b8d2a0c53/"
style="text-decoration: none; font-size: 10px; margin: 0;"
>
<img src="https://pikwizard.com/pw/medium/e004cd6dbaea6aa974e5c64b8d2a0c53.jpg" style="margin: 0; width: 100%;" alt="" />
<p style="font-size: 12px; margin: 0;">PikWizard</p>
</a>
</span>
</span>
Free (free of charge)
Free for personal and commercial use.
Author: Awesome Content
Similar Free Stock Images

Premium


Premium


Premium


Premium


Premium


Premium


Premium


Premium


Premium


Premium


Premium


Premium


Premium


Premium


Premium


Premium


Premium


Premium


Premium


Premium


Premium


Premium


Premium


Premium

