- Home >
- Stock Photos >
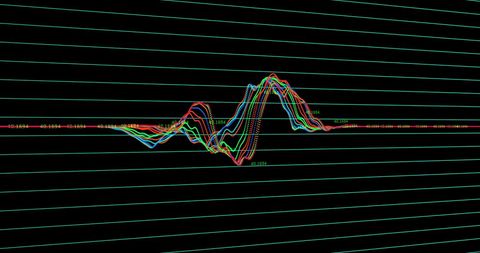
- Dynamic Stock Market Chart with Colorful Trend Lines
Dynamic Stock Market Chart with Colorful Trend Lines Image

Graph illustrating multiple colorful lines representing data trends on dark background with floating numbers. Ideal for use in articles and presentations related to investment patterns, market analysis, or financial strategy discussions. Can enhance reports on economic studies or serve as a visual aid in business and financial settings.
Powered by 


2
downloads
downloads
Tags:
More
Credit Photo
If you would like to credit the Photo, here are some ways you can do so
Text Link
photo Link
<span class="text-link">
<span>
<a target="_blank" href=https://pikwizard.com/photo/dynamic-stock-market-chart-with-colorful-trend-lines/5894606e6cb128eeeccbf5d9d3181580/>PikWizard</a>
</span>
</span>
<span class="image-link">
<span
style="margin: 0 0 20px 0; display: inline-block; vertical-align: middle; width: 100%;"
>
<a
target="_blank"
href="https://pikwizard.com/photo/dynamic-stock-market-chart-with-colorful-trend-lines/5894606e6cb128eeeccbf5d9d3181580/"
style="text-decoration: none; font-size: 10px; margin: 0;"
>
<img src="https://pikwizard.com/pw/medium/5894606e6cb128eeeccbf5d9d3181580.jpg" style="margin: 0; width: 100%;" alt="" />
<p style="font-size: 12px; margin: 0;">PikWizard</p>
</a>
</span>
</span>
Free (free of charge)
Free for personal and commercial use.
Author: Authentic Images
Similar Free Stock Images
Premium


Premium


Premium


Premium


Premium


Premium


Premium


Premium


Premium


Premium


Premium


Premium


Premium


Premium


Premium


Premium


Premium


Premium


Premium


Premium


Premium


Premium


Premium


Premium


Premium