- Home >
- Stock Photos >
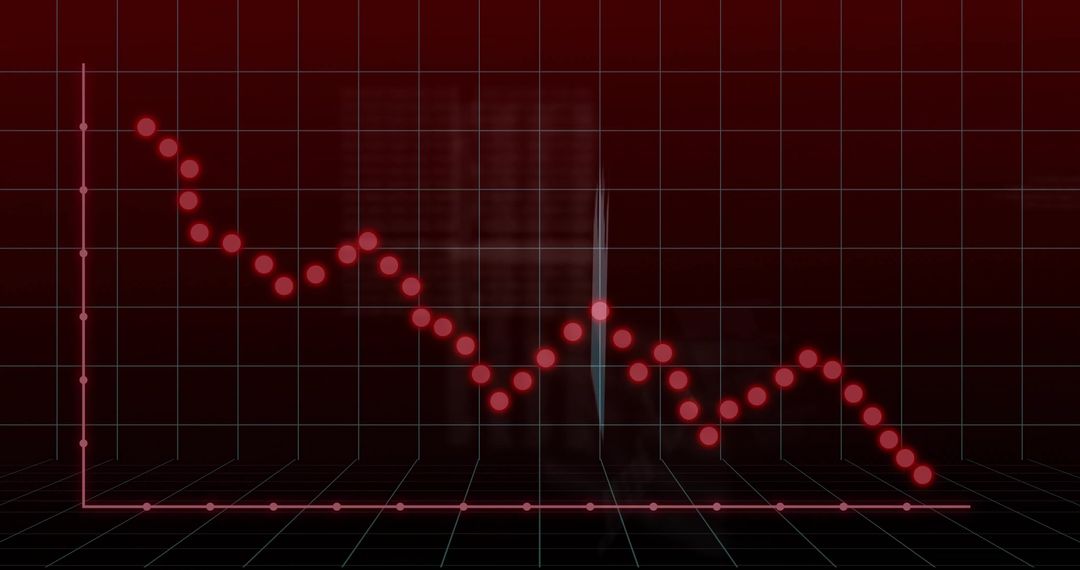
- Dynamic Stock Market Chart with Grid and Trend Lines
Dynamic Stock Market Chart with Grid and Trend Lines Image

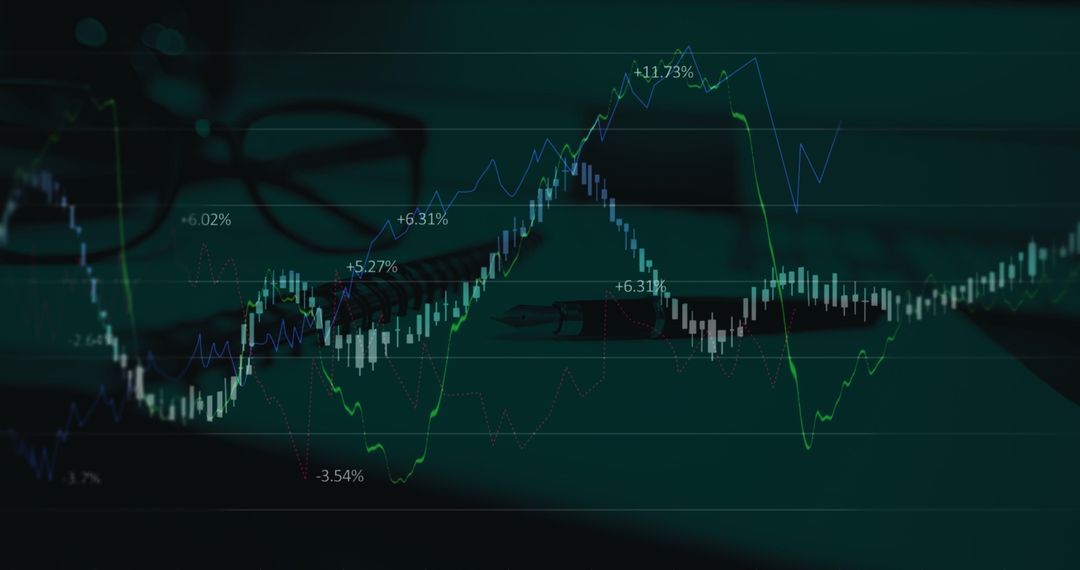
Image shows a financial trading chart with red and green bars and dynamic grid lines, illustrating various price trends. It is ideal for presentations, financial reports, investment strategy documents, or educational materials on stock market analysis or financial technology overviews.
Powered by 


4
downloads
downloads
Tags:
More
Credit Photo
If you would like to credit the Photo, here are some ways you can do so
Text Link
photo Link
<span class="text-link">
<span>
<a target="_blank" href=https://pikwizard.com/photo/dynamic-stock-market-chart-with-grid-and-trend-lines/e660daf971a306952b5c86420d5f8faf/>PikWizard</a>
</span>
</span>
<span class="image-link">
<span
style="margin: 0 0 20px 0; display: inline-block; vertical-align: middle; width: 100%;"
>
<a
target="_blank"
href="https://pikwizard.com/photo/dynamic-stock-market-chart-with-grid-and-trend-lines/e660daf971a306952b5c86420d5f8faf/"
style="text-decoration: none; font-size: 10px; margin: 0;"
>
<img src="https://pikwizard.com/pw/medium/e660daf971a306952b5c86420d5f8faf.jpg" style="margin: 0; width: 100%;" alt="" />
<p style="font-size: 12px; margin: 0;">PikWizard</p>
</a>
</span>
</span>
Free (free of charge)
Free for personal and commercial use.
Author: Authentic Images