- Home >
- Stock Photos >
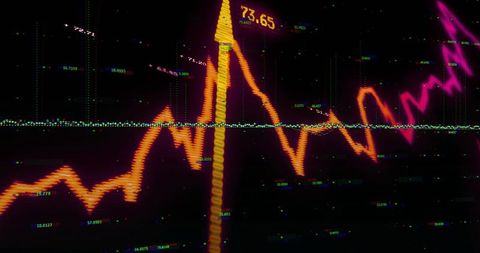
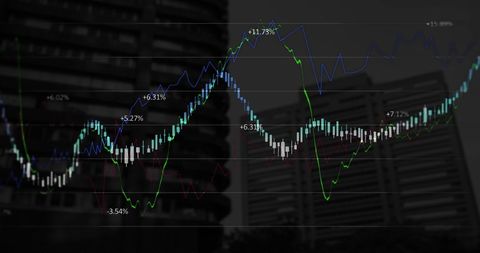
- Dynamic Stock Market Chart with Trend Data Overlay
Dynamic Stock Market Chart with Trend Data Overlay Image
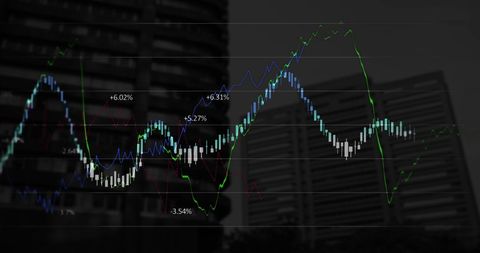
Displaying a dynamic digital chart with overlaid financial growth trends and trading data. Useful for presentations on economic analysis, investment strategies, and technological advancements in financial sectors.
Powered by 


2
downloads
downloads
Tags:
More
Credit Photo
If you would like to credit the Photo, here are some ways you can do so
Text Link
photo Link
<span class="text-link">
<span>
<a target="_blank" href=https://pikwizard.com/photo/dynamic-stock-market-chart-with-trend-data-overlay/ab7e6834fc6b0606129775805f87b577/>PikWizard</a>
</span>
</span>
<span class="image-link">
<span
style="margin: 0 0 20px 0; display: inline-block; vertical-align: middle; width: 100%;"
>
<a
target="_blank"
href="https://pikwizard.com/photo/dynamic-stock-market-chart-with-trend-data-overlay/ab7e6834fc6b0606129775805f87b577/"
style="text-decoration: none; font-size: 10px; margin: 0;"
>
<img src="https://pikwizard.com/pw/medium/ab7e6834fc6b0606129775805f87b577.jpg" style="margin: 0; width: 100%;" alt="" />
<p style="font-size: 12px; margin: 0;">PikWizard</p>
</a>
</span>
</span>
Free (free of charge)
Free for personal and commercial use.
Author: Awesome Content
Similar Free Stock Images

Premium


Premium


Premium


Premium


Premium


Premium


Premium


Premium


Premium


Premium


Premium


Premium


Premium


Premium


Premium


Premium


Premium


Premium


Premium


Premium


Premium


Premium


Premium


Premium


Premium