
- Home >
- Stock Photos >
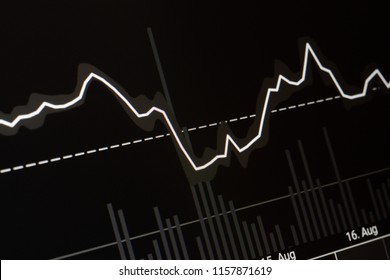
- Dynamic Stock Market Data Chart with Trend Line
Dynamic Stock Market Data Chart with Trend Line Image

Displaying a colorful graph with a prominent trend line indicating stock market change, this image is useful for financial websites and presentations. It conveys dynamic market fluctuations in a modern, digital format ideal for financial analyses, economic reports, and business consulting resources.
Powered by  - Get 15% off with code: PIKWIZARD15


2
downloads
downloads
Tags:
More
Credit Photo
If you would like to credit the Photo, here are some ways you can do so
Text Link
photo Link
<span class="text-link">
<span>
<a target="_blank" href=https://pikwizard.com/photo/dynamic-stock-market-data-chart-with-trend-line/61e67cee648d3b2d1a3ba8700c9743e6/>PikWizard</a>
</span>
</span>
<span class="image-link">
<span
style="margin: 0 0 20px 0; display: inline-block; vertical-align: middle; width: 100%;"
>
<a
target="_blank"
href="https://pikwizard.com/photo/dynamic-stock-market-data-chart-with-trend-line/61e67cee648d3b2d1a3ba8700c9743e6/"
style="text-decoration: none; font-size: 10px; margin: 0;"
>
<img src="https://pikwizard.com/pw/medium/61e67cee648d3b2d1a3ba8700c9743e6.jpg" style="margin: 0; width: 100%;" alt="" />
<p style="font-size: 12px; margin: 0;">PikWizard</p>
</a>
</span>
</span>
Free (free of charge)
Free for personal and commercial use.
Author: Authentic Images
Similar Free Stock Images

Premium


Premium


Premium


Premium


Premium


Premium


Premium


Premium


Premium


Premium


Premium


Premium


Premium


Premium


Premium


Premium


Premium


Premium


Premium


Premium


Premium


Premium


Premium


Premium

