- Home >
- Stock Photos >
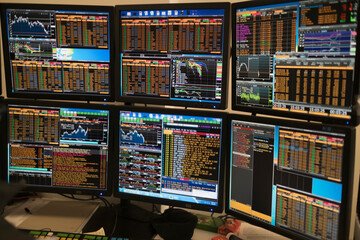
- Dynamic Stock Market Data Display with Graph Overlay
Dynamic Stock Market Data Display with Graph Overlay Image

This image features a digitally enhanced stock market board displaying fluctuating percentages alongside multiple graph lines. It suggests concepts such as financial data analysis and economic reporting. Ideal for use in finance blogs, investment analyses, business presentation backgrounds, or educational content focused on stock trading and economic studies.
Powered by 


2
downloads
downloads
Tags:
More
Credit Photo
If you would like to credit the Photo, here are some ways you can do so
Text Link
photo Link
<span class="text-link">
<span>
<a target="_blank" href=https://pikwizard.com/photo/dynamic-stock-market-data-display-with-graph-overlay/fe6c90156a6111f61de35e798f8517d5/>PikWizard</a>
</span>
</span>
<span class="image-link">
<span
style="margin: 0 0 20px 0; display: inline-block; vertical-align: middle; width: 100%;"
>
<a
target="_blank"
href="https://pikwizard.com/photo/dynamic-stock-market-data-display-with-graph-overlay/fe6c90156a6111f61de35e798f8517d5/"
style="text-decoration: none; font-size: 10px; margin: 0;"
>
<img src="https://pikwizard.com/pw/medium/fe6c90156a6111f61de35e798f8517d5.jpg" style="margin: 0; width: 100%;" alt="" />
<p style="font-size: 12px; margin: 0;">PikWizard</p>
</a>
</span>
</span>
Free (free of charge)
Free for personal and commercial use.
Author: Authentic Images
Similar Free Stock Images

Premium


Premium


Premium


Premium


Premium


Premium


Premium


Premium


Premium


Premium


Premium


Premium


Premium


Premium


Premium


Premium


Premium


Premium


Premium


Premium


Premium


Premium


Premium


Premium


Premium