- Home >
- Stock Photos >
- Dynamic Stock Market Diagrams With Numeric Fluctuations
Dynamic Stock Market Diagrams With Numeric Fluctuations Image
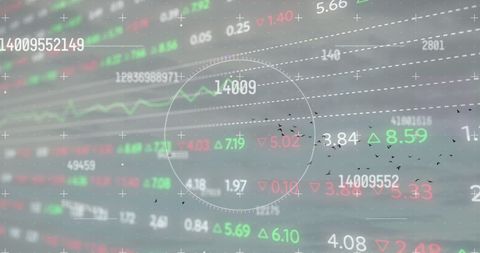
Depicts ongoing changes in stock market statistics projected on futuristic digital interface. Suitable for illustrating concepts of financial fluctuations, trading strategies, investment potential, economic headlines, or business analytic content.
Powered by 


2
downloads
downloads
Tags:
More
Credit Photo
If you would like to credit the Photo, here are some ways you can do so
Text Link
photo Link
<span class="text-link">
<span>
<a target="_blank" href=https://pikwizard.com/photo/dynamic-stock-market-diagrams-with-numeric-fluctuations/3aa27e60f681cd14361b315564912036/>PikWizard</a>
</span>
</span>
<span class="image-link">
<span
style="margin: 0 0 20px 0; display: inline-block; vertical-align: middle; width: 100%;"
>
<a
target="_blank"
href="https://pikwizard.com/photo/dynamic-stock-market-diagrams-with-numeric-fluctuations/3aa27e60f681cd14361b315564912036/"
style="text-decoration: none; font-size: 10px; margin: 0;"
>
<img src="https://pikwizard.com/pw/medium/3aa27e60f681cd14361b315564912036.jpg" style="margin: 0; width: 100%;" alt="" />
<p style="font-size: 12px; margin: 0;">PikWizard</p>
</a>
</span>
</span>
Free (free of charge)
Free for personal and commercial use.
Author: Awesome Content
Similar Free Stock Images

Premium


Premium


Premium


Premium


Premium


Premium


Premium


Premium


Premium


Premium


Premium


Premium


Premium


Premium


Premium


Premium


Premium


Premium


Premium


Premium


Premium


Premium


Premium


Premium