- Home >
- Stock Photos >
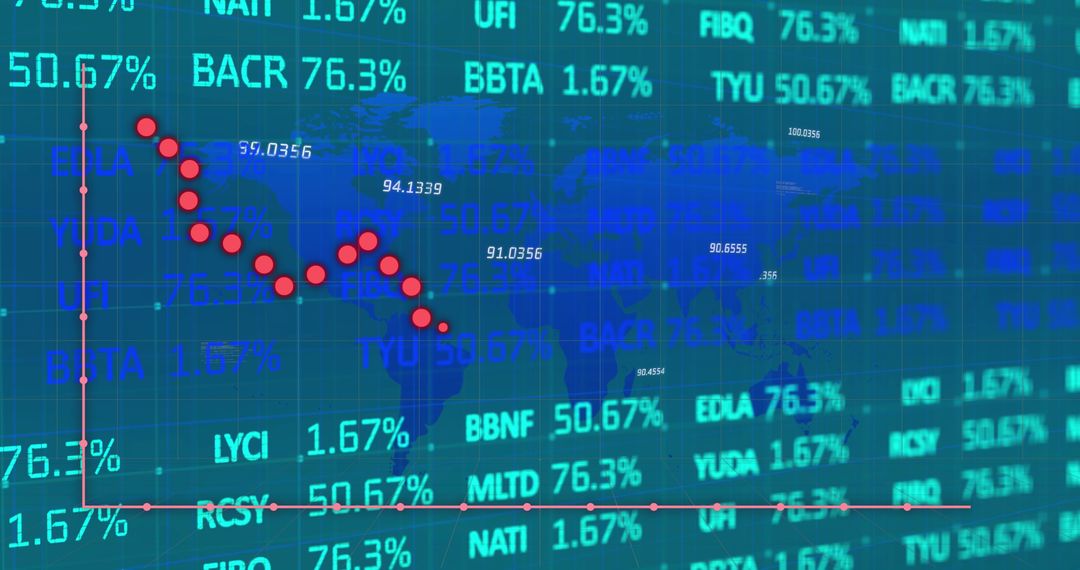
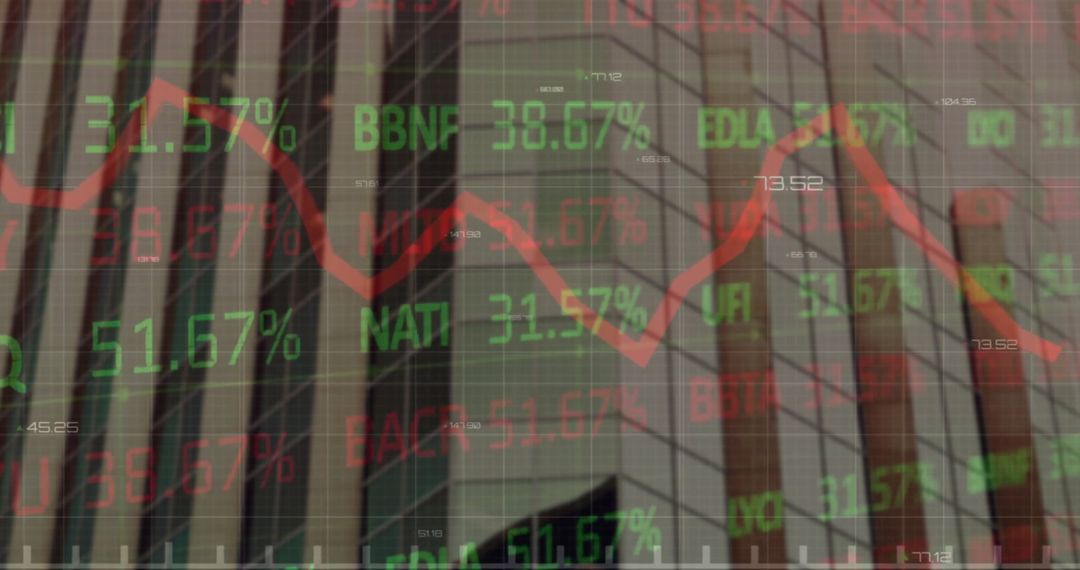
- Dynamic Stock Market Ticker with Financial Graph Visualization
Dynamic Stock Market Ticker with Financial Graph Visualization Image

This visual depicts an active stock market ticker highlighting digital financial data and statistics. Incorporating colorful charts and numerical analytics, this image represents global economy and business technology concepts. Suitable for use in economic reports, financial blogs, technology presentations, and investment platforms reflecting market trends.
Powered by  - Get 15% off with code: PIKWIZARD15


2
downloads
downloads
Tags:
More
Credit Photo
If you would like to credit the Photo, here are some ways you can do so
Text Link
photo Link
<span class="text-link">
<span>
<a target="_blank" href=https://pikwizard.com/photo/dynamic-stock-market-ticker-with-financial-graph-visualization/721822f61db9e0e0a13cc528420b1542/>PikWizard</a>
</span>
</span>
<span class="image-link">
<span
style="margin: 0 0 20px 0; display: inline-block; vertical-align: middle; width: 100%;"
>
<a
target="_blank"
href="https://pikwizard.com/photo/dynamic-stock-market-ticker-with-financial-graph-visualization/721822f61db9e0e0a13cc528420b1542/"
style="text-decoration: none; font-size: 10px; margin: 0;"
>
<img src="https://pikwizard.com/pw/medium/721822f61db9e0e0a13cc528420b1542.jpg" style="margin: 0; width: 100%;" alt="" />
<p style="font-size: 12px; margin: 0;">PikWizard</p>
</a>
</span>
</span>
Free (free of charge)
Free for personal and commercial use.
Author: Awesome Content
Similar Free Stock Images

Premium


Premium


Premium


Premium


Premium


Premium


Premium


Premium


Premium


Premium


Premium


Premium


Premium


Premium


Premium


Premium


Premium


Premium


Premium


Premium


Premium


Premium


Premium


Premium