
- Home >
- Stock Photos >
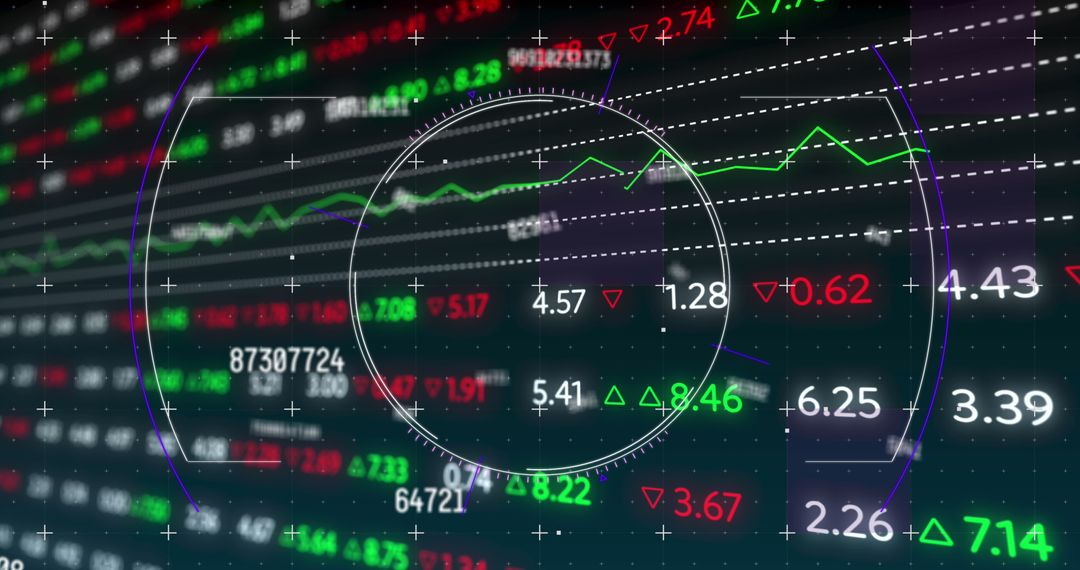
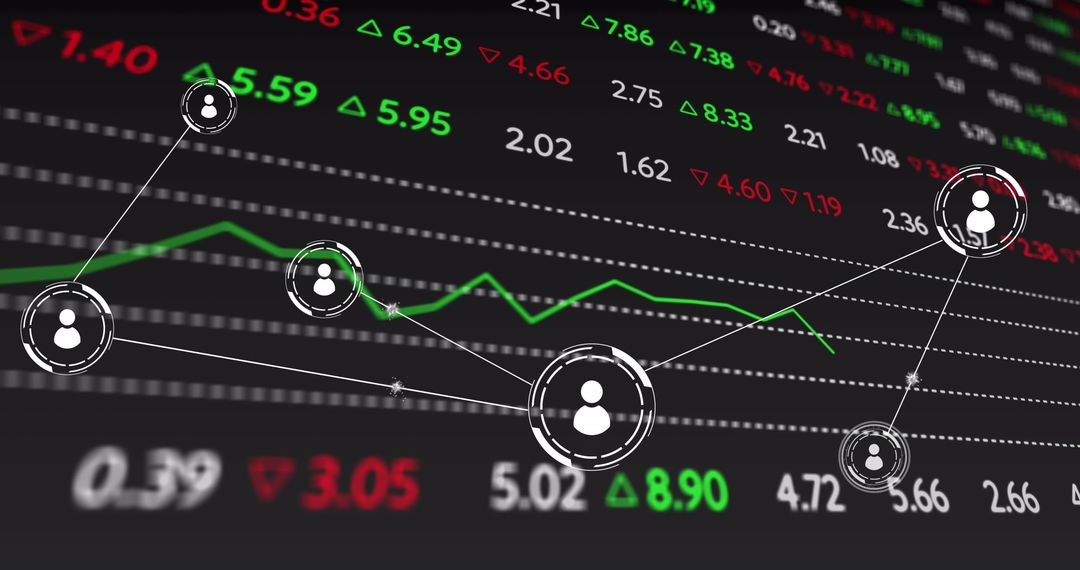
- Dynamic Stock Market Trading Data Analysis
Dynamic Stock Market Trading Data Analysis Image

Digital interface displays fluctuating data with dynamic stock market information and green line graph. Useful for representing investments, global business, and trading strategies. Ideal for illustrating concepts in finance-related articles, market analysis reports, and financial forecasting presentations.
Powered by  - Get 15% off with code: PIKWIZARD15


2
downloads
downloads
Tags:
More
Credit Photo
If you would like to credit the Photo, here are some ways you can do so
Text Link
photo Link
<span class="text-link">
<span>
<a target="_blank" href=https://pikwizard.com/photo/dynamic-stock-market-trading-data-analysis/076279dc9254a81cf1a523f73f7d059f/>PikWizard</a>
</span>
</span>
<span class="image-link">
<span
style="margin: 0 0 20px 0; display: inline-block; vertical-align: middle; width: 100%;"
>
<a
target="_blank"
href="https://pikwizard.com/photo/dynamic-stock-market-trading-data-analysis/076279dc9254a81cf1a523f73f7d059f/"
style="text-decoration: none; font-size: 10px; margin: 0;"
>
<img src="https://pikwizard.com/pw/medium/076279dc9254a81cf1a523f73f7d059f.jpg" style="margin: 0; width: 100%;" alt="" />
<p style="font-size: 12px; margin: 0;">PikWizard</p>
</a>
</span>
</span>
Free (free of charge)
Free for personal and commercial use.
Author: Awesome Content
Similar Free Stock Images

Premium


Premium


Premium


Premium


Premium


Premium


Premium


Premium


Premium


Premium


Premium


Premium


Premium


Premium


Premium


Premium


Premium


Premium


Premium


Premium


Premium


Premium


Premium


Premium

